The market for test data analysis tools is highly fragmented. There are a bunch of reasons for this: Traditionally, many hardware vendors supply specific data acquisition and analysis software for their devices. Furthermore, testing data comes in a large variety of data formats, modalities and data sizes. Also, test engineers often build in-house workflows on top of Excel, MATLAB or Python to cover their specific analysis and visualization needs.
Over time, the heterogeneity of available tools and data management systems have become a big headache for engineering teams and organizations: Even for small teams it can be a struggle to fuse data from different measurement devices. And larger organizations become inevitably trapped in data silos that prevent sharing data across disciplines and teams. This problem has been known for quite some time in the testing community and both vendors and users have taken steps to solve it: Some vendors are such has HBK and Dewesoft are pushing for open standards on the data acquisition side. Standards such as the ASAM measurement data format (MDF) or ASAM ODS have greatly enhanced the interoperability in the automotive industry. However, legacy systems and workflows remain, and the reality today is that most measurement data remains siloed.
In recent years, test data analysis has also become increasingly important and challenging. Due to cheaper sensors and better connectivity, the amount of data has dramatically increased. At the same time, shorter development cycles and a software-focused approach (over-the-air-updates) have increased the need for efficient testing approaches. These are major reasons why many large organizations such as automotive OEMs have started to develop in-house testing data management and analysis platforms based on off-the-shelve cloud services. These solutions typically leverage big data technologies and generic data visualization tools. While these solutions make sense for use cases that focus on aggregate values in large amounts of fleet data, they typically don’t offer test engineers interactive access to raw measurement data.
Categories of testing data analysis software
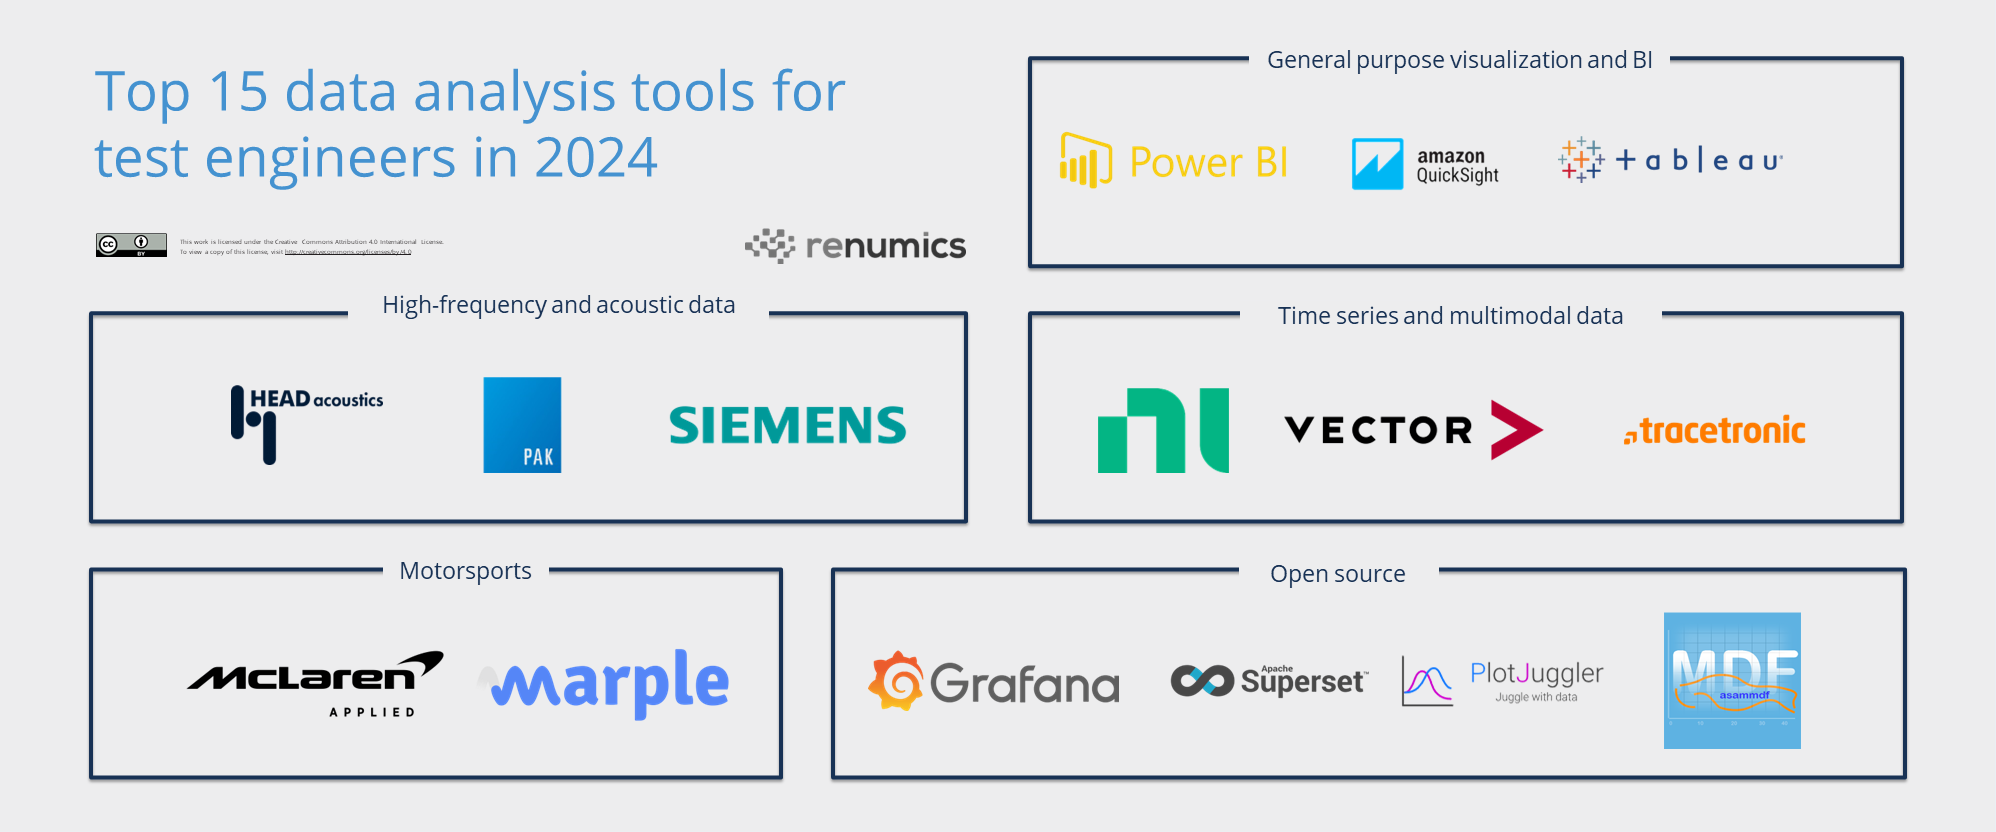
In this article we cover 15 widely used test data analysis tools that engineers should know about. Typically, such tools are chosen based on use case, the relevant data types/formats and the available budget. To simplify our tool categories, we mix these dimensions and define five distinct groups for our TOP 15 list:
- General purpose visualization and BI tools for web-based analysis of aggregate values on large amount of testing data.
- Desktop-based engineering tools to deeply analyze raw time series and multimodal data.
- Data processing and visualization tools aimed at high-frequency and acoustic data
- Telemetry analysis tools used in motorsports
- Testing data analysis tools that are published as open source.
It should be noted that some tools would fit in two or more categories.
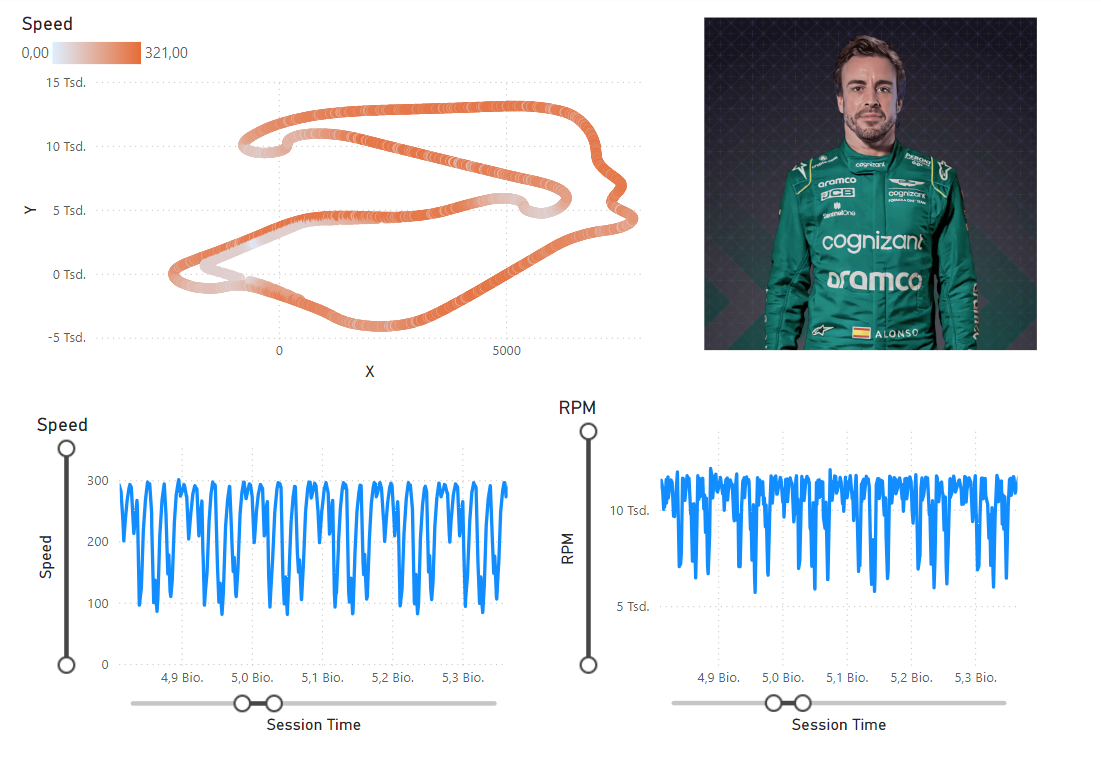 Fig. 1: Simple PowerBI dashboard for displaying F1 telemetry.
General purpose visualization and BI
When testing data is already stored in a data lakehouse infrastructure, off-the-shelve business intelligence solutions can be used to build dashboards for data analytics. This works well for aggregate views on large amounts of testing data (e.g. fleet data). However, engineers typically have limited interactive access to the data: Not only are SQL programming skills necessary to build these dashboards, but classical BI tools don’t allow to access raw measurement data due to performance constraints. The most popular BI tools in testing are:
- Microsoft PowerBI has the largest market share in the business intelligence market. It has well rounded capabilities and currently the go-to tool at several auto OEMs for fleet data. Depending on your needs, pricing can be tricky for small teams.
- Amazon Quicksight is a good choice for creating web-based dashboards when you are already on AWS. The functionality is not as extensive as Power BI and the pricing model is a bit different, so you must evaluate it for your use case.
- Tableau pioneered BI tooling and is considered to be the best data visualization tool in this category. In contrast to PowerBI, it also runs on Mac and Linux. However, it is less popular in the engineering automotive space due to the bundling effects from AWS and Microsoft.
Time series and multimodal data
Across industries, most sensor data can be classified as time series data with a frequency up to 1 kHz. In automotive, vehicle bus data (e.g. CAN-bus) is an important example. Engineers typically use specialized desktop tooling and custom data storage systems for this type of data. Often, these tools are also capable of visualizing additional modalities such as video and GPS data:
- Vector CANoe is the standard tool for developing electric/electronics (e/e) architectures and ECUs. Although the package provides many different capabilities including simulations, it is used by many automotive engineers to deeply analyze vehicle bus data.
- NI DIAdem is a general-purpose test data analysis environment that support most typical test data formats and types. DIAdem is a desktop software and runs on Windows.
- Tracetronic trace.check is a solution to evaluate software testing results in automotive. The tool runs both on the desktop and in the cloud and can fuse signals from different sources according to ASAM and Autosar standards.
High-frequency and acoustic data
High frequency time series data such as vibration and acoustic signals are especially challenging to work with. Not only because of the data size, but also because the analysis is typically done in the frequency domain. Analysis tools for this data typically come with a wide range of data preparation and processing options (e.g. FFT, order analysis, psychoacoustics).
- ArtemiS by Head Acoustics is an established desktop tool for sound and vibration analysis. It provides an all-in-one desktop environment that targets both exploratory analysis for troubleshooting and automating repetitive measurement tasks.
- The PAK software family by Müller-BBM covers the complete measurement process from data acquisition and data management to data analytics. In addition to the classic PAK desktop analysis software, there is a web-based version called PAK live that supports data streaming from a cloud storage.
- Siemens Simcenter Testlab is a workflow-oriented tool for vibration and acoustic analysis. The desktop software integrates well into other Simcenter products such as simulation and SCADA systems.
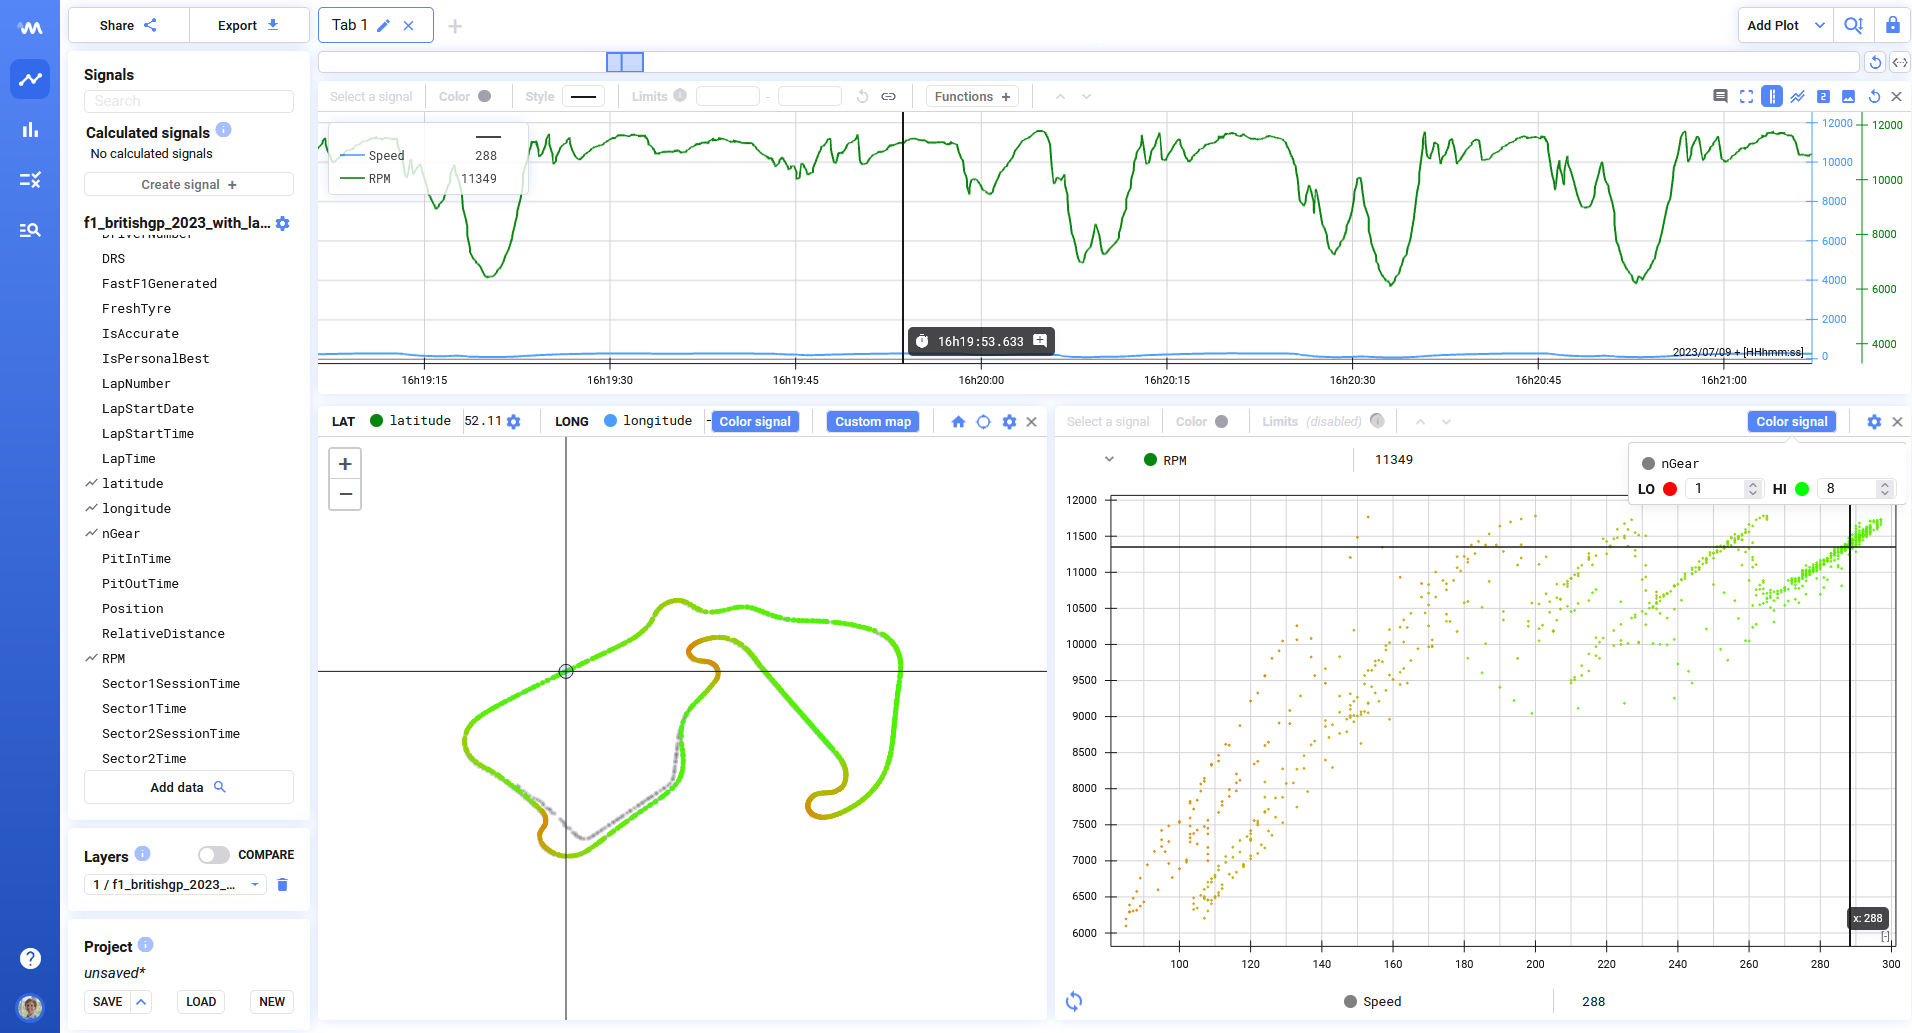 Fig. 2: Interactive Marple report for displaying F1 telemetry.
Motorsports
Racing is a challenging proving ground for engineering tools and processes. This is especially true for data analysis workflows: Motorsports telemetry is not only used for general testing and validation, but also for optimizing the car setup, real-time strategy insights and driver coaching. Racing teams often use a mix of commercial and in-house tooling.
- The Advanced Telemetry Linked Acquisition System (ATLAS) by McLaren Applied is the standard tooling for Formula 1 telemetry. The ATLAS client is a .NET-based application that allows to configure flexible workbooks and displays to visualize telemetry data.
- Marple is a cloud-native solution for test data analysis. In contrast to generic BI tools, it allows for interactive visualization of large time series data. It also supports additional data mining and collaboration functionality. Marple is not only used in Motorsports, but in other many other domains as well.
Open source
In a world full of proprietary formats and data silos, open source tooling offers many advantages for end-users: Reduced vendor lock-in, interoperability thanks to open standards and adaptability through community contributions. However, there exists very little dedicated open source tooling for engineering data analysis. In the following list we also include more general BI-like software that is commonly used for testing data analysis.
- Grafana is a go-to solution for observability time series visualization. It supports to quickly build metrics and visualizations on top of an SQL endpoint like InfluxDB. Although it supports zooming into time series data, it lacks performance and efficiency for many engineering data analysis workflows.
- Apache Superset is a very popular open source alternative to PowerBI. Superset includes an intuitive user interface for building interactive dashboards featuring a database connector, a query editor as well as drag’n’drop charting abilities. It supports cross filtering and drill-down functionality for root cause analysis.
- With more than 4k stars on Github, PlotJuggler is the most popular time series visualization tool geared towards engineers. It is very modular, fast and integrates into different data formats and sources. While it provides direct time series visualization, it does not support data analytics.
- Asammdf is a fast parser and editor for the ASAM Measurement Data Format (MDF). It is both used as a library for file conversion and as a frontend to inspect MDF data. Although the project keeps a low profile, its download stats (80k downloads a week) are a testament to the large user base in the engineering community.
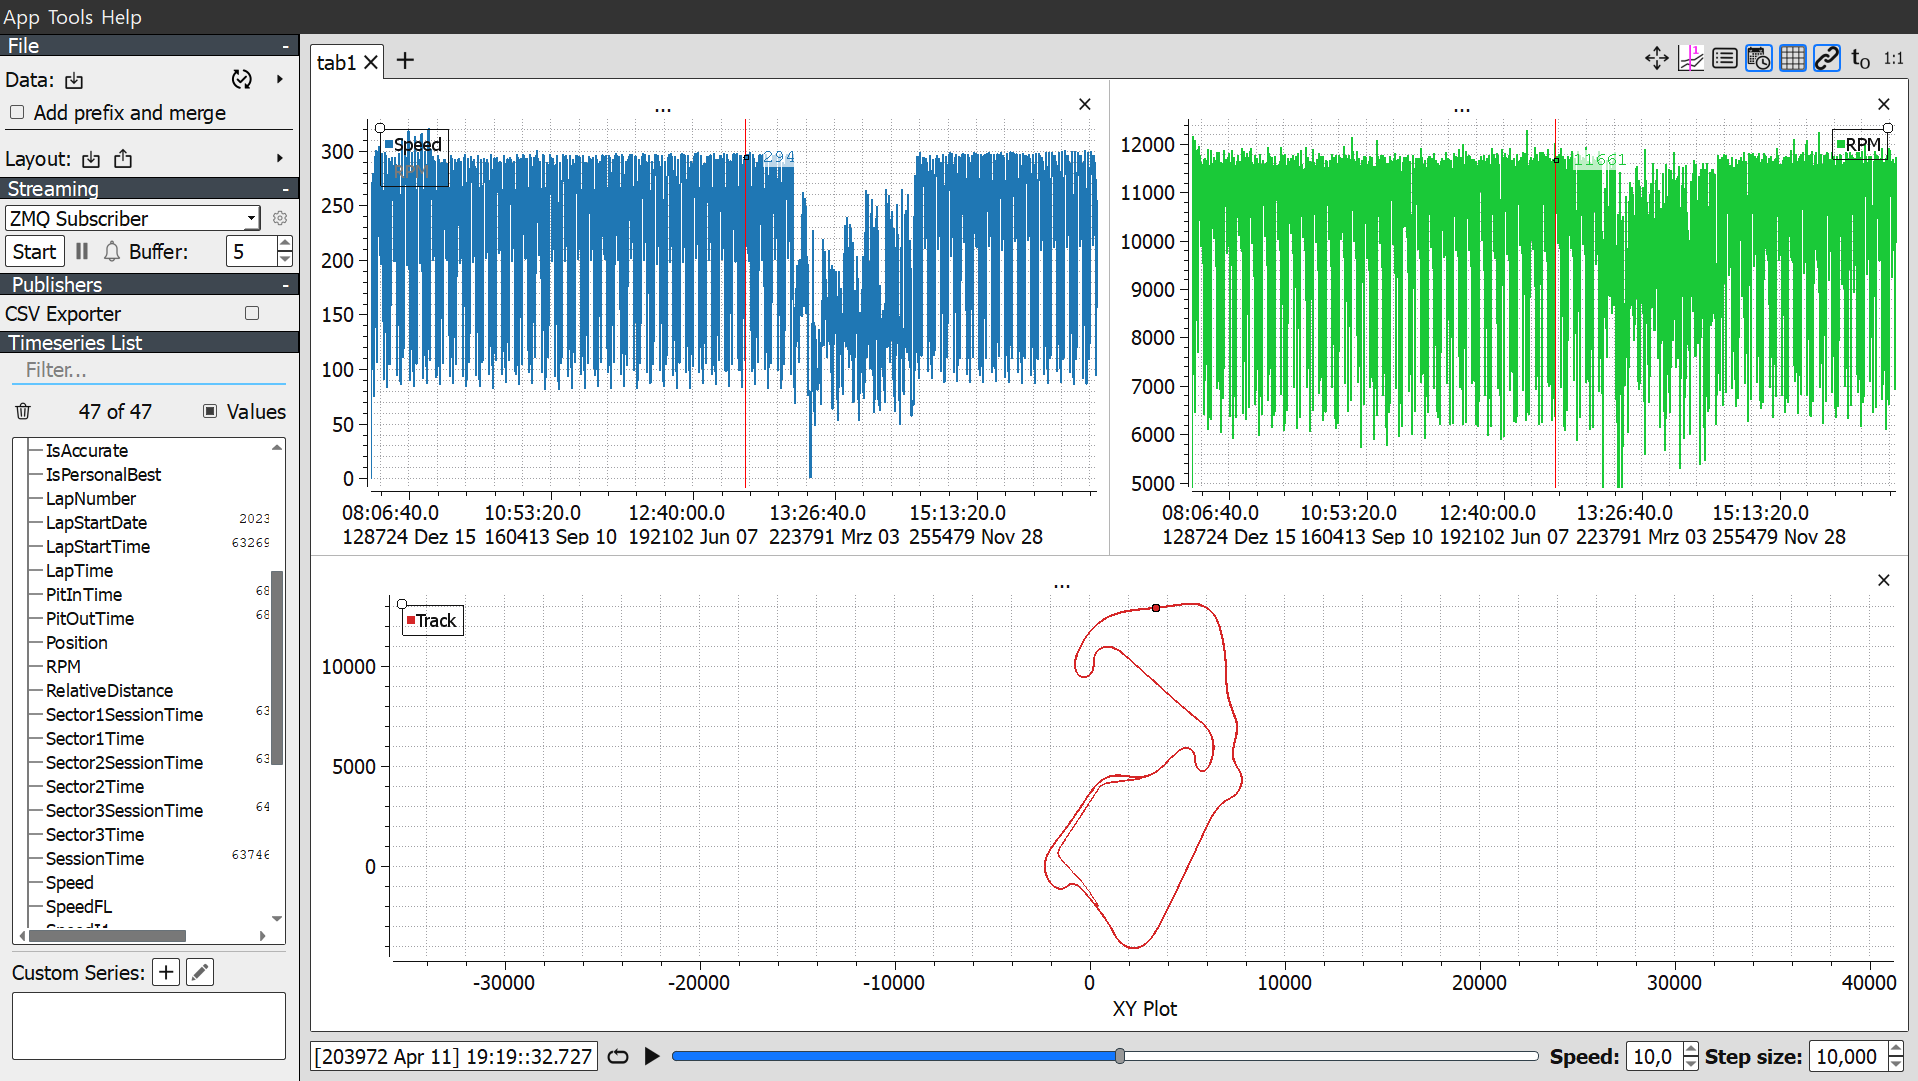 Fig. 2: Plotjuggler visualization for displaying F1 telemetry.
Conclusions
We presented 15 tools that are commonly used to analyze engineering data. We hope the collection helps you and your team to find the right tool for your use case and budget.
Although this list constitutes only a (small) subset of all available testing data analysis software, it already highlights the major divide that engineers face when analyzing data: Generic BI tooling allows to build standardized dashboards to gain insights into large amounts of data that is stored in a cloud-native data lakehouse. Deskop-based engineering tools allow to inspect raw measurement data in detail. However, there is very little tooling that allows engineers to do both at the same time.
We expect that this will change soon. An important technology driver for this democratization of testing data analytics are AI assistants that can help engineers to query complex datasets and to quickly build ad-hoc visualizations. You can read more about this approach in our blog post Top 5 Use Cases for AI in Automotive Testing Data Analysis.