Collecting training data for your machine learning model can be challenging. Among other things, you have to actively make sure that you cover all groups of data points relevant to your use case and that the data is sufficiently diverse. Also, you want to ensure that the different groups of data points are represented to match their occurrence in real-world data. A violation of this principle is often referred to as unwanted bias.
A typical scenario is that you have a large amount of historical data as the basis for your modeling process. Often this data might be the result of a relatively unstructured data collection effort of your customer that acts according to the motto: "I found all this old data, just check if you can solve our problem with that." You will immediately find yourself in the situation of having to verify to what extent the data matches the real-world data of your use case. You also want to curate the data to match your use case as good as possible.
We illustrate this difficulty on a publicly available sound dataset. Our task for the example is to create a system detecting ambulance siren noise from audio samples. This could help car drivers recognize approaching rescue vehicles more quickly. As we are based in Germany, an additional constraint is that the system also has to work for European sirens. To solve the task, we start with the beforementioned labeled dataset containing different varieties of siren noise and noise belonging to other noise sources. The dataset, in this case, originates from a collection of siren samples from a sound database. So most likely, we have to put some effort into removing unwanted bias from the dataset to match our real-world data.
Our plan for adapting the dataset is to perform a detailed analysis of our model's performance to identify data segments that the model has a problem with but are highly relevant for our use case. For this, we first train an initial audio classification model and evaluate the model results on an instance level (Fig. 1).
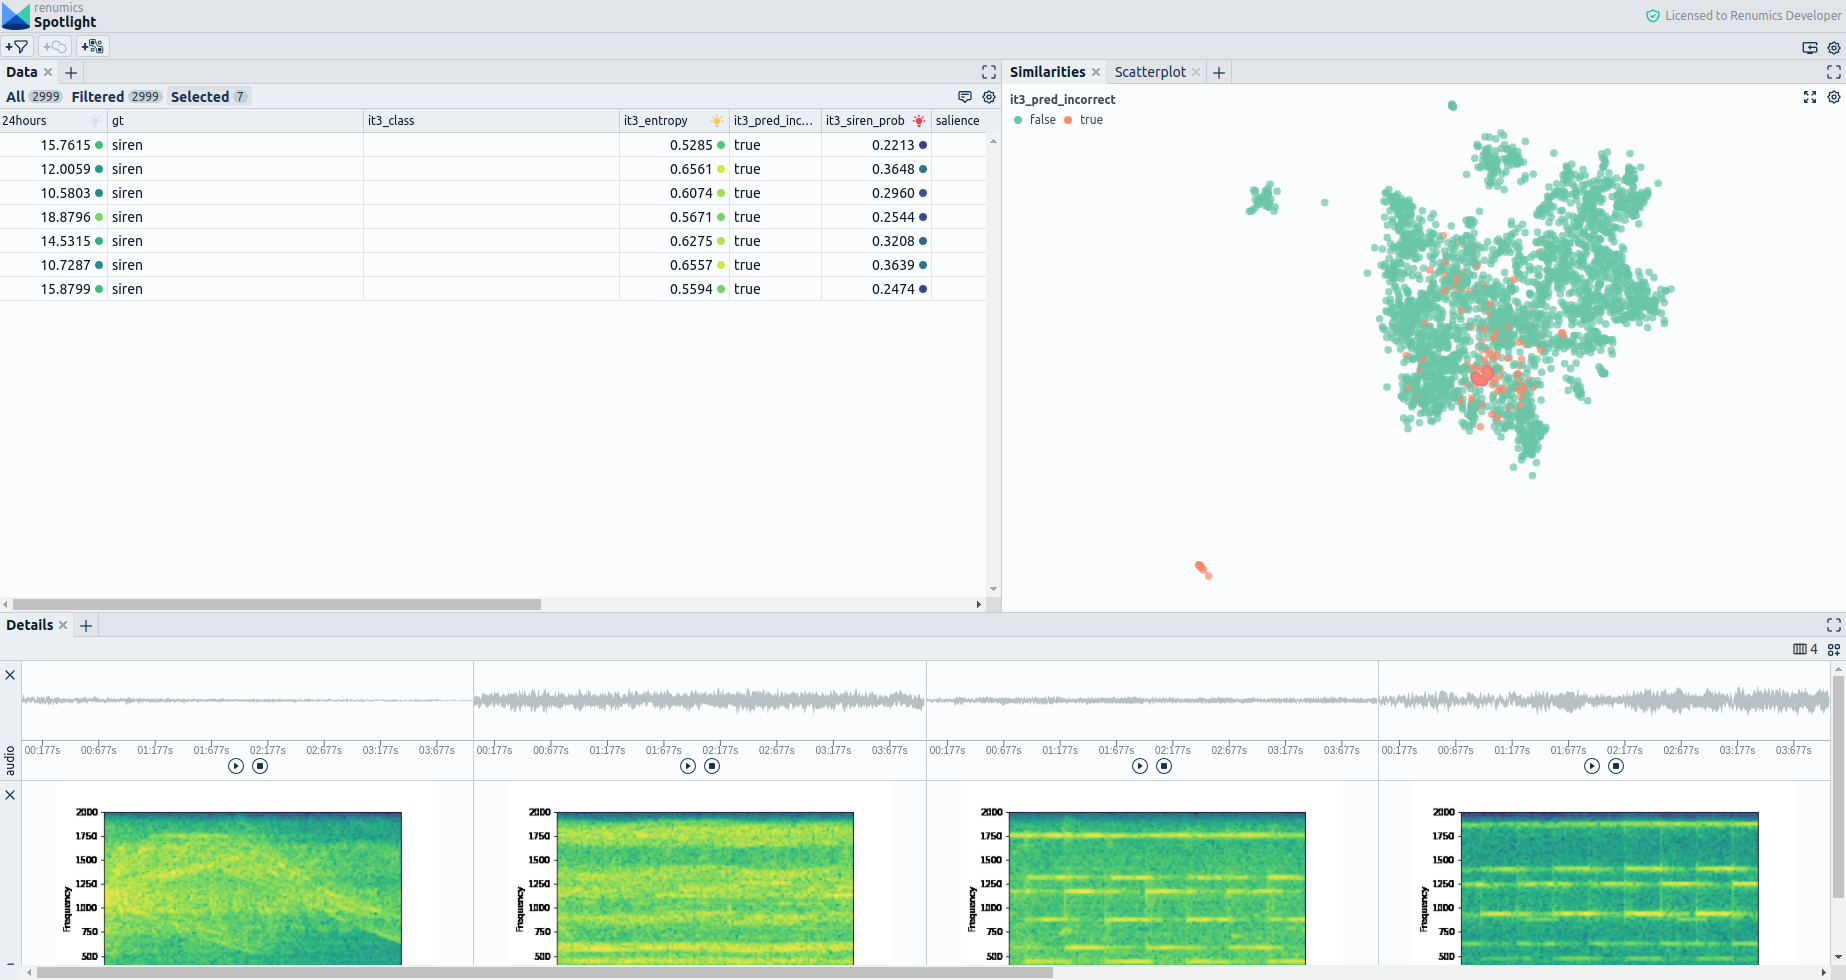
The Similarity Map (part of Renumics Spotlight) is a Dimensionality Reduction Plot in which we can interactively explore misclassifications. Here, the data is sorted by semantic similarity using the semantics captured in a pre-trained audio embedding model. This helps us review different problems not only on an instance but on a cluster level, which significantly speeds up the review process.
We can identify several bias-related problems with our dataset when performing a cluster-wise review. The main problem in this case seems to be a strong unintended bias towards American siren noise. We identified this specific bias by realizing that a region with particularly many misclassifications contained mostly European sirens or sirens that do not follow the American siren pattern. This bias definitely has to be fixed, considering our system is intended to assist a driver in recognizing german ambulance sirens. In this case, we decide to balance our training data to mitigate the overrepresentation of American siren samples and collect more European siren samples from additional data sources. Of course, there is a lot more you could do to fix this problem, but the above measures might serve as a reasonable basis for further improvements.
We hope this gave you a glimpse of the importance of curating your data to match the production data of your use case. Feel free to book a demo.