Introduction
Automating Visual Inspection is a challenging task many companies currently tackle in their production settings. And in contrast to a few years back, nowadays, easy-to-use cloud services like Amazon Lookout for Vision or Google Cloud's Visual Inspection AI help set up those models reasonably quickly. Concretely, they often typically help carry out model training without setting up complicated training pipelines and extensive manual hyperparameter tuning. Also, they offer easy-to-use deployment options in the cloud and on-premise. However, while those stages of the ML life cycle are supported so well, some seem to be almost unaddressed. Primarily data-related actions such as data exploration, curation, annotation, and qualitative model evaluation are only supported in a limited fashion. Yet, you should not miss out on those steps as they can be crucial for creating robust machine learning models in real-world industry use cases. Therefore, our goal in this post is to show you which steps you might want to additionally consider when using Amazon Lookout for Vision to build robust ML models.
Scenario
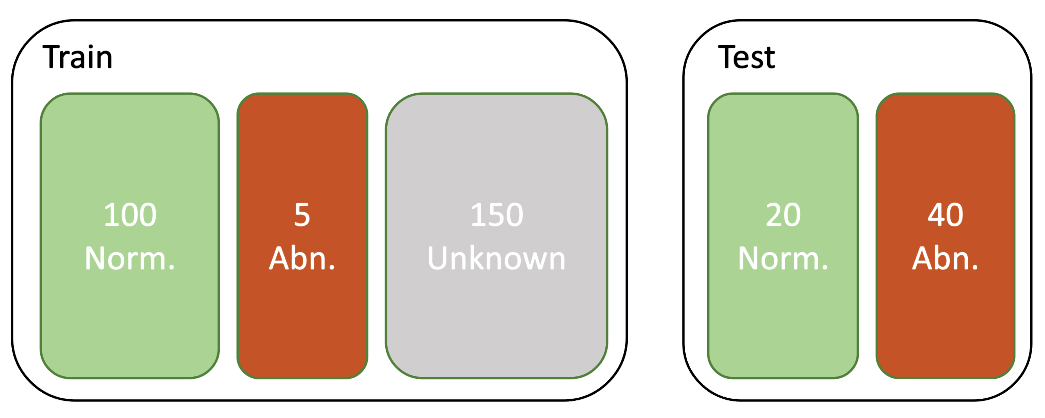
Before we start, I will give you a quick overview of our visual inspection scenario. The data we use for our demonstration is coming from the MVTec Anomaly Detection Dataset and has the following properties (Fig. 1):
- The data comes from a cold-start scenario where 100 images are known to be anomaly free, and five images are known to contain anomalous items. They are coming from a production line operating normally and were manually quality-checked.
- There are about 150 additional images for which we are not sure if they contain anomalies or can be considered normal. We want to leverage those images for training as well.
- We have a test set of around 60 images that contain labeled images for normal and abnormal items. We want to use this holdout set to evaluate our model.
Our goal is to use Amazon Lookout to train a model for distinguishing between normal and abnormal items as well as possible.
Note that in real-world industry use cases, the number of data points is often is two orders of magnitude higher. Also, the imbalance between normal and abnormal examples is often vastly higher. These circumstances make the problem of data curation and annotation even harder.
Understanding, curating and annotating the data
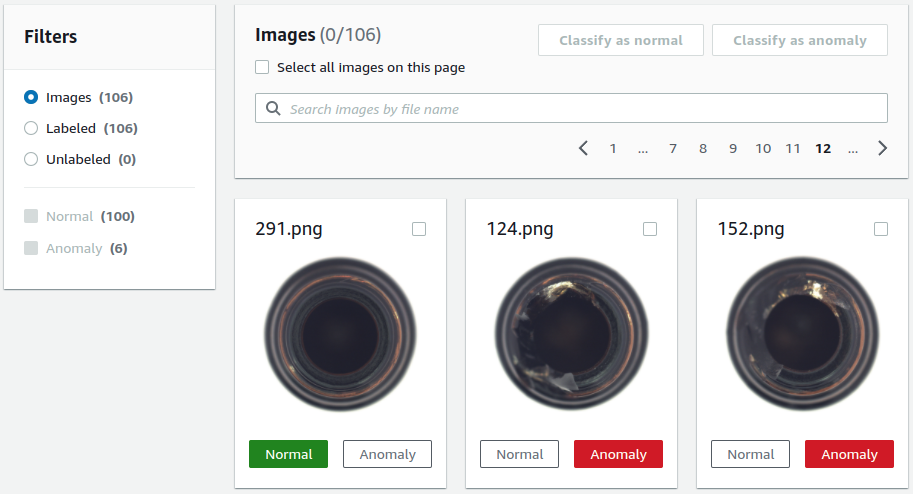
Amazon Lookout for Vision offers a Web Interface in which you can upload data and afterward browse through the data using a paginated list. Only image data is supported and shown in the labeling view (Fig. 2). You can assign labels in a binary form (Normal/Anomaly).
While those features may be enough for academic benchmarks or straightforward use cases, they are relatively limited when it comes to real-world industry use cases.
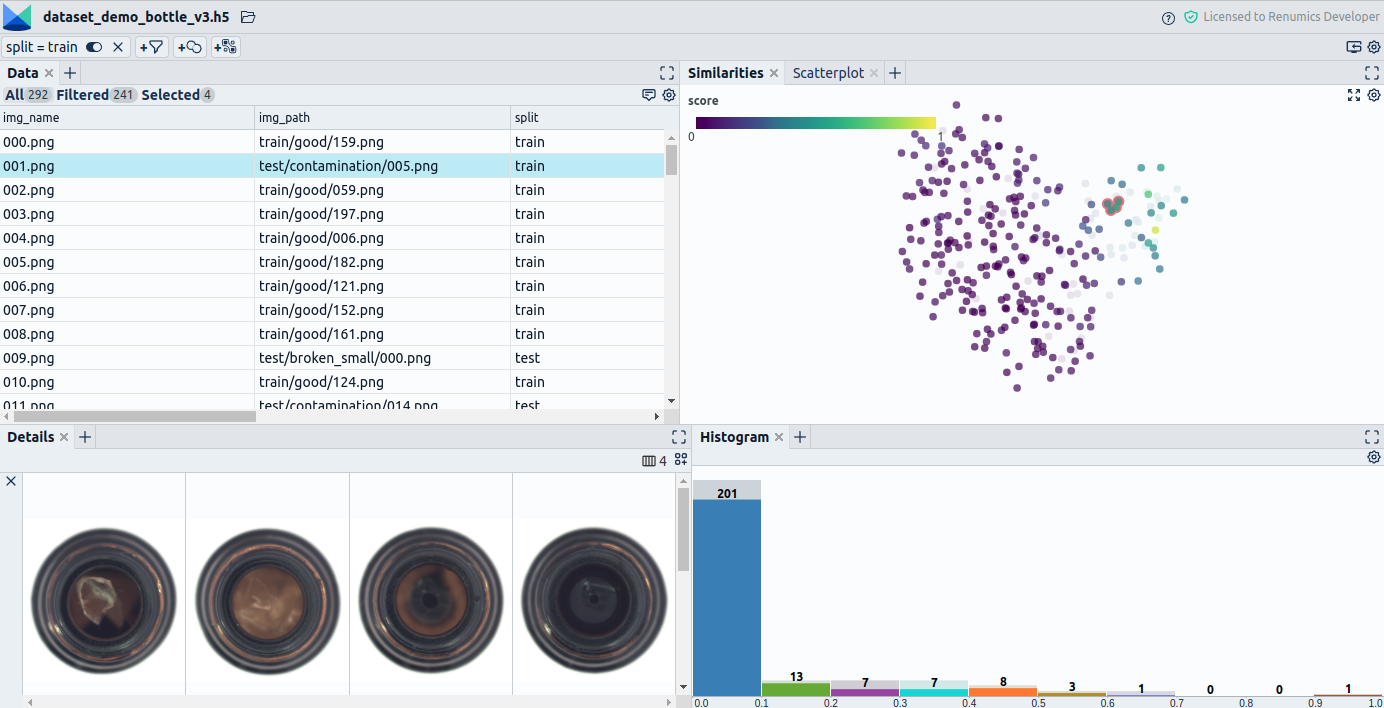
A substantial limitation is that the options for navigating through the data are limited to a paginated list sorted by upload order. For creating high-quality annotations, you want to have more advanced navigation options (Fig. 3). In our projects, we often:
- Use filtering and sorting by metadata to get hints on an instance's label and populations present in the data.
- Use synchronized, interactive plots to navigate through and look at the data from different angles to get additional hints on connections in the data.
- Use different similarity measures to compare data points. We obtain them using either interpretable classical features or learned similarity measures (learned unsupervised or self-supervised).
Another limitation is that the data display is limited to the input images for the model. In real-world use cases, it is often unavoidable to leverage additional information such as metadata to decide on a specific label. In other cases, additional data can make an annotation assignment easier. We thus recommend doing the following:
- Use multiple modalities that are easier to grasp for a human labeler and thus give additional hints on an instance's label.
- Use metadata that is helpful or required as a context for deciding on an instance's annotation.
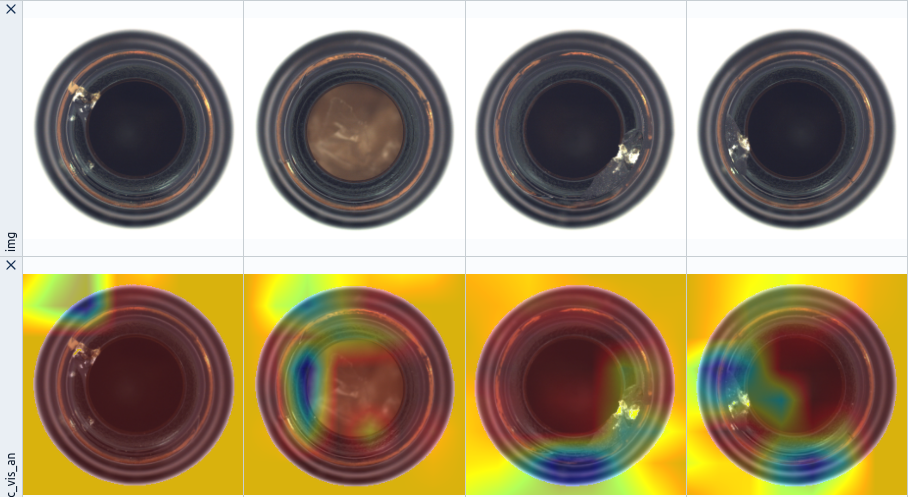
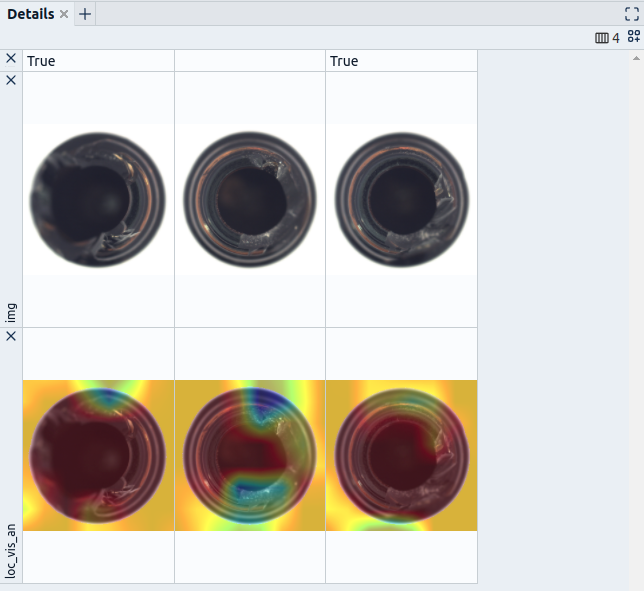
- If you can generate additional information such as heatmaps that mark the potential location of an anomaly, e.g., extracted from a self-supervised technique via explainability techniques, consider giving that to your labelers as well (Fig. 4).
Another limitation that stood out to us is only categorizing instances into Normal/Anomaly when annotating the data. In our projects, we often experience that a more fine-granular annotation can help gain a better problem understanding and potentially be useful in modeling the problem (Fig. 5). We thus can give the following advice:
- Especially in a phase where the problem understanding is not fully developed, use annotations as a tool to break down your dataset into groups of data points relevant to the problem. Also, mark exceptional cases such as outliers or data points where you are unsure how to incorporate them into your modeling process.
- Think about the interactions between your labeling convention and your modeling of the problem. Consider the upsides and downsides of different annotations and consider if a more fine-granular way of annotation potentially can give you more freedom in case you want to change your modeling later on. Also, consider if more fine-granular labels can boost your model's performance or enable new uses for the model in the later stages of your project.
Training
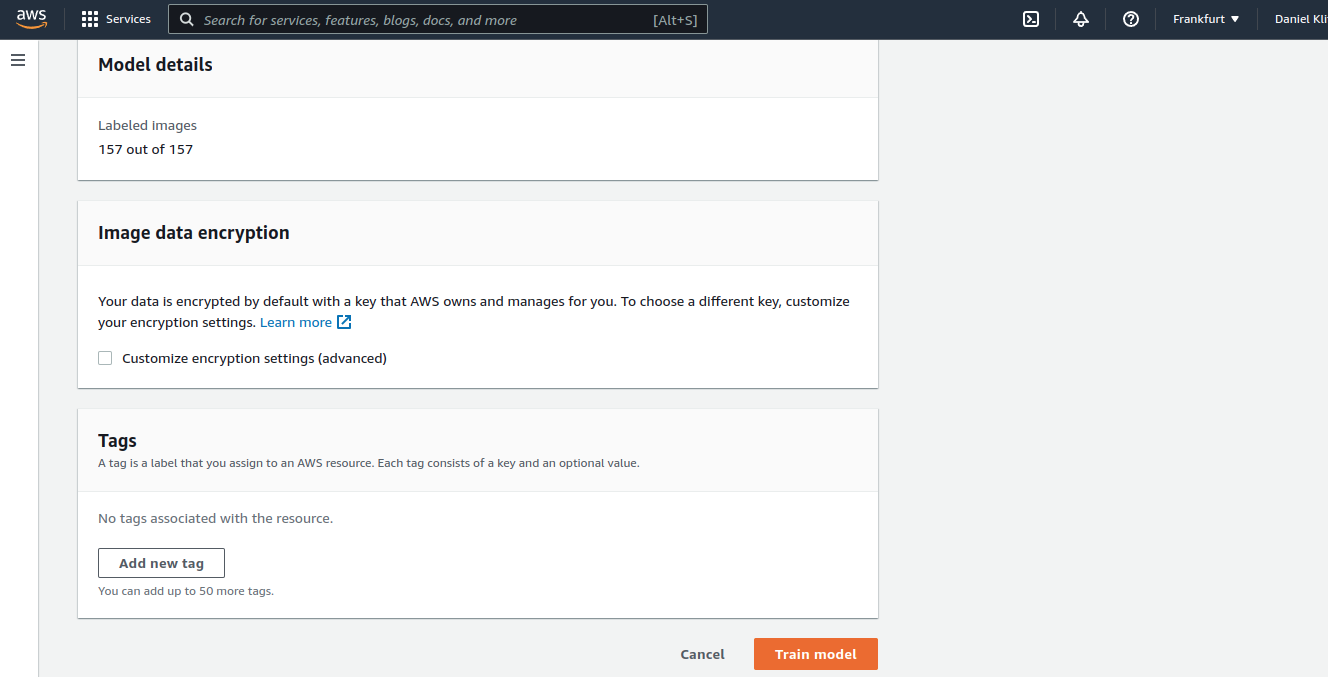
Training is the stage where Amazon Lookout for Vision can shine. No manual specification of hyperparameters or setup of training pipelines is required. All you have to do here is request a model training and get a readily trained model in approximately 30 minutes (Fig. 6).
Depending on your problem and business case, it can make sense to consider if this plug-and-play solution is the right choice for you. You can probably act according to the following rule from a business case perspective. If the problem you are tackling is critical to your business model and you want to set yourself apart from competitors by solving this problem, consider investing the resources to develop a custom solution. If this is not the case, buy a solution, e.g., use Amazon Lookout for Vision. From a technical standpoint, think about if your problem is solved best by using only image data or if your problem is solvable at all using only images. If, e.g., metadata could boost your model's performance or make specific problems solvable in the first place, weigh that against the cost of developing such a model.
Evaluating and improving your model
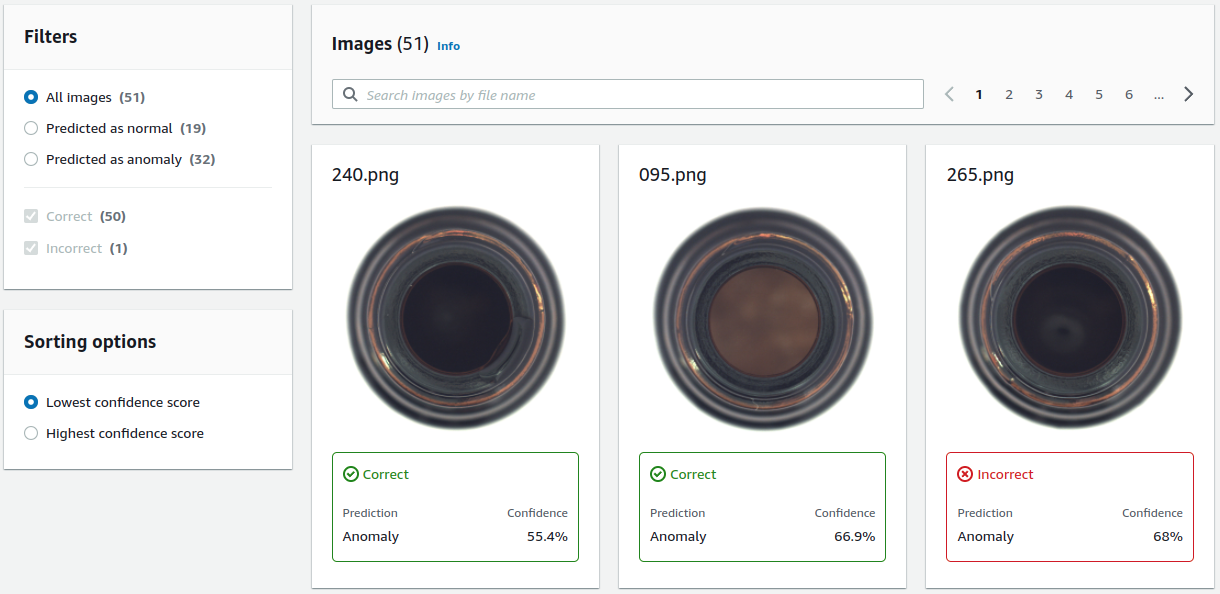
For model evaluation, Amazon Lookout for Vision offers an interface similar to the annotation interface shown in Fig. 2. Additionally, there are possibilities to sort by prediction result (Anomaly/Normal) and correctness of the prediction and sort according to model confidence (Fig. 7). Of course, Amazon Lookout for Vision also displays some global metrics such as precision, recall, and F1 score of the anomaly class.
The lack of advanced navigation capabilities is also a pain when making sense of model misclassifications. These limitations are partly comparable to the limitations listed for the annotation stage. In general, for the evaluation, the following holds:
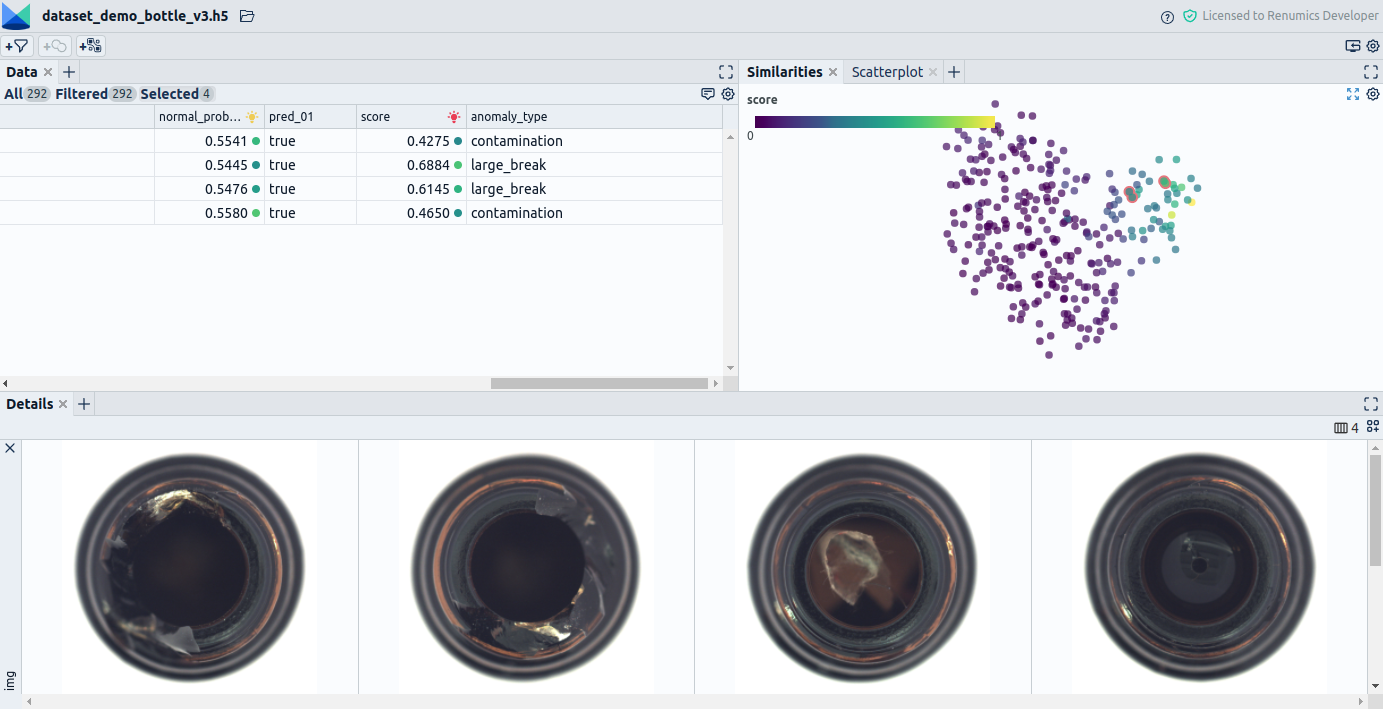
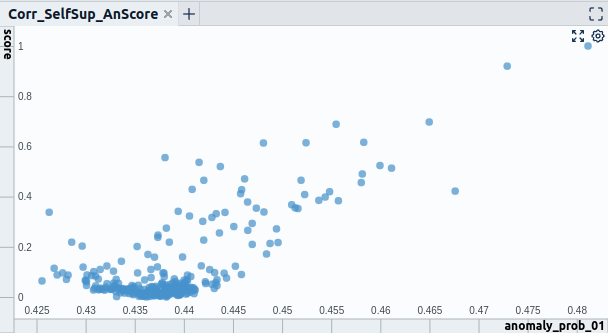
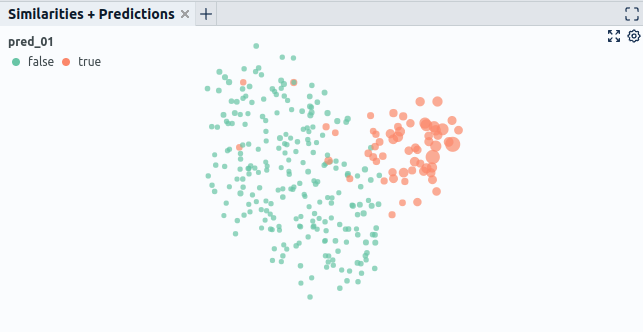
- Getting a feel for problems of your model is hard if you only view the predictions in a list. Try to identify clusters that are subject to similar problems. You can, for example, achieve this by correlating input data or metadata with your model's predictions. Concretely you could look at how single features correlate with model errors (Fig. 8.1). Also, using dimensionality reduction techniques, more advanced visualizations can show the correlation of multiple input features with model errors (Fig. 8.2).
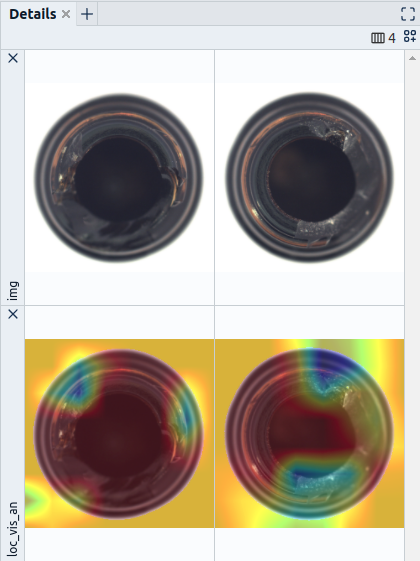
- Also, leverage interactive visualizations of input data and model outputs to grasp problems more quickly. E.g., look at different views of your part simultaneously if you have multiple camera angles or look at additional modalities like a 3D scan of your part if available. Additionally, it can make sense to visualize information related to model outputs, such as explanations for model decisions generated, e.g., via libraries like SHAP or Captum (Fig. 9).
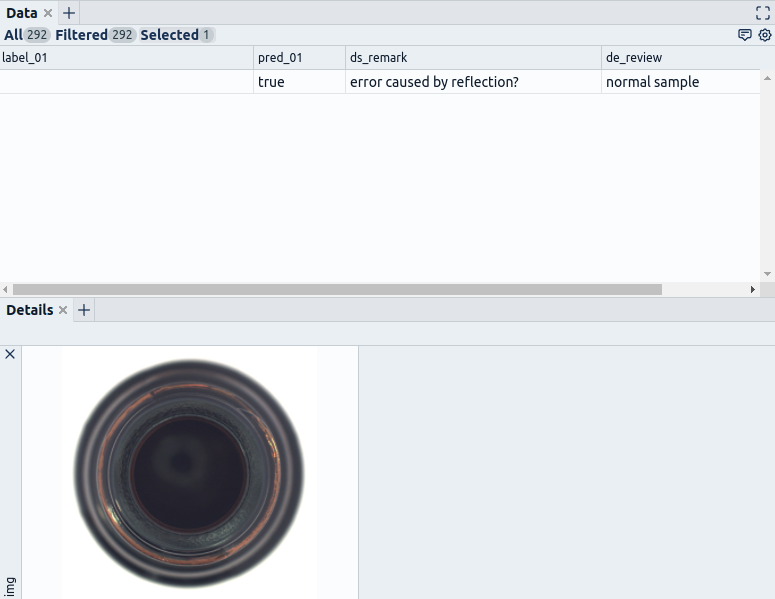
Other limitations relate to the limited collaboration capabilities. Here in our experience, it is not sufficient for a single role to review model predictions on itself. Instead, a review process often requires multiple roles that interact with each other to detect problems and deduce measures for improvement. Probably consider the following:
- Incorporate roles representing the data science and domain expert sides into the review process.
- Offer them collaboration possibilities exceeding the labeling of correct and incorrect predictions. They need the means to communicate efficiently, e.g., marking unclear input data, predictions, and annotations. Also, you should enable iteration on those problems as this promotes quicker decisions and thus improves the data quality after all (Fig. 10).
Similar points are also valid for monitoring and improving your model. Amazon Lookout for Vision offers the possibility of running inference on unlabeled data and accepting or correct inference results for an updated dataset. Here almost all limitations discussed above apply as well as also here additional data and comparisons can help discover patterns in misclassifications and speed up annotation. However, further advice for this stage would be to relate those new predictions to already labeled data. Putting data in relation can really bring out additional patterns and let you discover issues such as data or concept drift.
Conclusion
While Amazon Lookout for Vision is great for quickly setting up a Visual Inspection model solely based on images, looking beyond its limited data curation, annotation, and model evaluation capabilities might pay off for you. Even though the Amazon product can shine in stages such as training and deployment, it can make sense to complement these strengths with methods to support a more data-centric approach to model development. General topics you can think about enhancing via additional, modular tooling are data visualization, navigation through the dataset, and collaboration between the data scientist and domain expert. You could either add this functionality yourself or connect your existing tooling via the official SDK or resort to specialized data curation and annotation software. We hope this gave you a glimpse of the strengths and limitations you might meet when using AWS Lookout for Vision for your Visual Inspection case and some ideas for making the most out of the service. Also, feel free to book a demo for our data curation tool, Spotlight, which you saw in some of the screenshots in this article.