Motivation
As explained in Part 1 of this post, training a robust model for condition monitoring is challenging. Concretely, making the right decisions in your data collection process and solving existing data problems are necessary for achieving robust model performance. As in Part 1 of the article, we will thus again help you to ask the right questions and equip you with a checklist you can use when collecting and preparing data for your condition monitoring use case. While Part 1 focuses on finding noisy data and creating meaningful training and evaluation data, we will now focus on biases and feature selection.

Data Curation Checklist
For completeness, we again included the complete checklist to give an overview of the whole data curation process.
Summary (tl;dr)
- Does the data contain outliers, anomalies, or errors ? (Part 1) a. Errors in recording equipment? b. Differences in recording setup? c. Falsely labeled data because of unnoticed defect?
- Does the data contain duplicates? (Part 1) a. Exact duplicates caused by overlapping data sources? b. Near-duplicates caused by overly similar scenarios, like testing sequences of a machine monitored.
- How should the data be split into training, validation, and test sets? (Part 1) a. Duplicates split between train and test data? b. Split is meaningful for the desired generalization? c. All important data segments represented in the evaluation?
- Does training data match production data? Are there unwanted biases? a. Does the training data match the expected production data? b. Are there biases that should not contribute to the decisions of the model?
- Which features are helpful for the task at hand? a. Are there redundant features? b. Are there non-meaningful features that could confuse the model? c. Are there preprocessing options that can simplify the modeling task? d. Which combination of features performs best and is most robust?
Does the training data match your expected production data? Are there biases
that affect model performance in an unwanted way?
- For the robust performance of machine learning models, it is crucial to ensure that the training data distribution matches the test data reasonably well. Thus it is vital to check your data for unwanted bias that could cause a deviation from the either known or expected production data. Additionally, even if the training data matches the production data well, it can still make sense to resample it to steer the model's decisions beneficially. For your condition monitoring data thinking about the following could be interesting: Maybe you don't have your production data yet and can only guess how it will look. This would, for example, be the case if you collected potential anomalies in a testing scenario and not in your real production line and want to leverage the data for training your model. One solution would be to collect at least a small amount of "real production data" that you can compare with your historical training data. If this is not possible, at least try to leverage the knowledge of domain experts to make adjustments to your training data to match the expected production data better.
- Check for biases matching the current production data but that you don't want to affect the model's decisions. E.g., it could be that a low speed of the fan you want to monitor with your model only makes up a small fraction of your training data, while there is a default speed that makes up most of the "normal" data for your anomaly detector. This will cause the anomaly detector to be biased towards associating the default speed with normal operations, while more uncommon speeds are more associated with anomalies. This is often referred to as domain shift. It is up to the domain expert to decide whether it is legitimate that maintaining the default speed is a sign of healthy operations or if the model should be more invariant to the fan speed. In the latter case, resampling the data by oversampling minority fan speeds could be a solution. Another example would be sporadic events such as a sounding alarm in your production environment. The model will have trouble associating this with normal operations if only shown a few examples in the "normal" data. Here also, collecting more examples or oversampling might help.
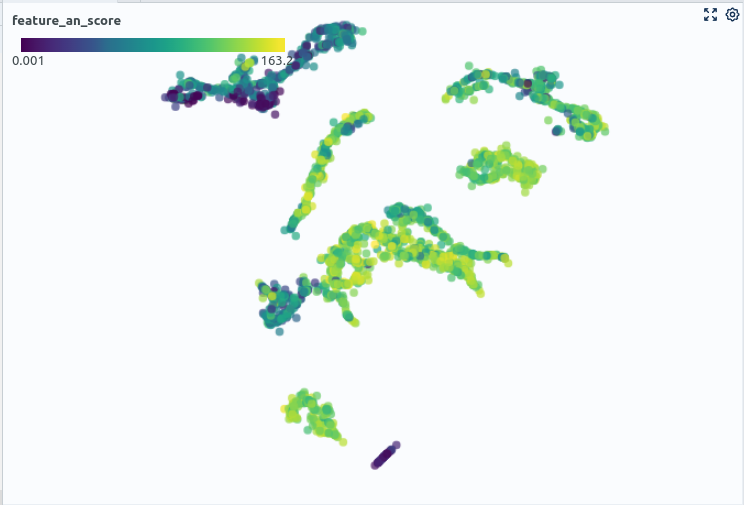
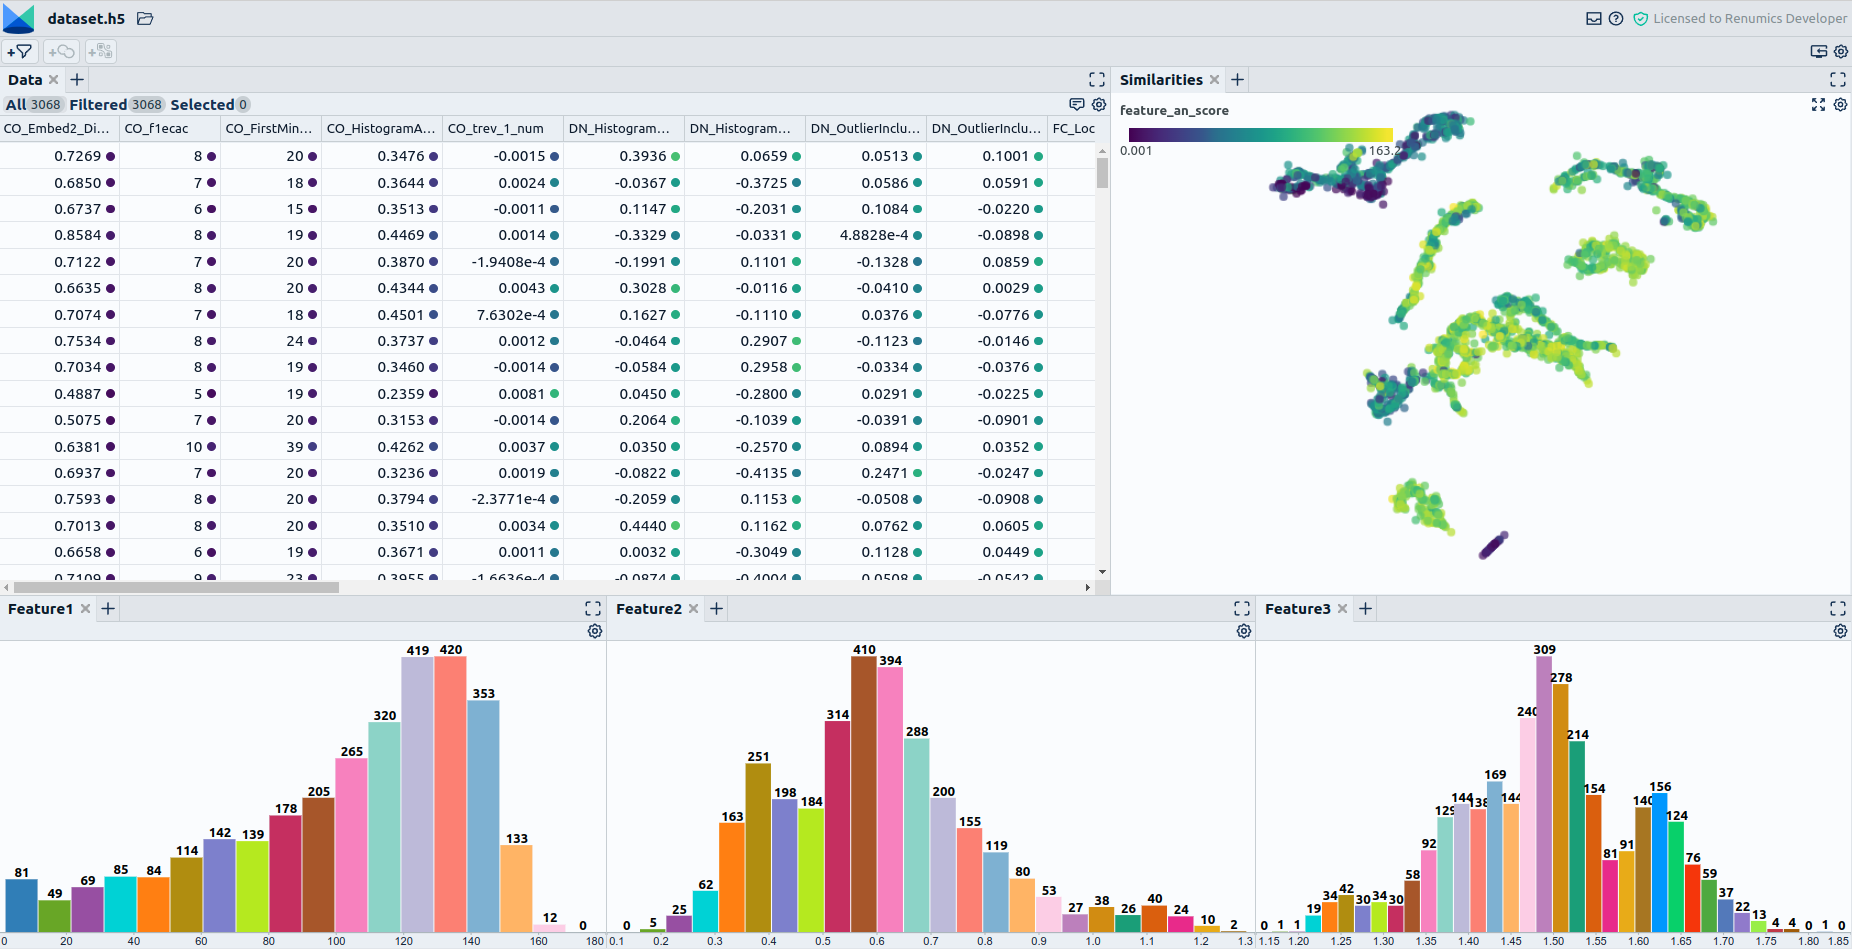
When dealing with the assessment of biases and the comparison of training and production data, beware that there are a variety of tools assisting you with this problem: 1.For comparing training with production data tools such as evidently can help detect differences in features, model predictions, and so on between training and production data. 2. Visualizing the training data is the way to go if the production data is unknown. How this is done best varies depending on the type of data. When assessing tabular data with interpretable scalar features, consider simple visualization techniques like plotting the value distribution of single features over histograms. This could be useful when applied to the metadata of your recordings. Here visualization libraries such as seaborn really can shine. When it comes to high-dimensional, complex data such as audio recordings, visualization is more challenging. One possibility here is to use lower-dimensional representations of that data to get a feel for the populations present in the data and their proportions. E.g., if a seemingly important population is only making up a small cluster in a 2D projection of the audio data, its count should probably be increased. A library that can help you with this is UMAP (Fig. 2). 3. Use baseline models to direct your focus on problematic data segments. This can help pinpoint problematic data quickly and limit manual browsing. E.g., if you want to get an idea of which underrepresented data might be troublesome for your model, train a simple baseline model. You can then use the sample-wise prediction results to check where the model has high-reconstruction errors in seemingly clean data. The results will often correspond to rare events or underrepresented operating conditions.
Which features are helpful for the task at hand?��
While the previous section focuses on the "sample dimension", a part of data curation is also deciding on the proper features to train your model. This can significantly affect the performance and robustness of your model but also the amount of data required to train your model or training time. Concretely the following problems might occur in your condition monitoring case:
- When generating many features suitable for condition monitoring, some of them might be redundant. Consider removing some of them to simplify model training.
- There might be features that have no meaningfulness regarding the presence of anomalies and could even confuse your model. You might want to consider removing those features.
- Are there features or data transformations that can help the model solve the task at hand? E.g., is the difference in audio level between different channels meaningful, or does it make sense to remove this in preprocessing as it should not influence the prediction result?
- Which feature combination is the most robust one? Probably depending on the type of input data, different features perform best. Consider identifying data sections in which specific features seem to be problematic. Decide for a combination of features that seem to capture a variety of cases.
When dealing with the problems mentioned above, the following tooling might be helpful:
- Common automatic feature selection mechanisms based on statistical tests or models, such as shown in the scikit-learn feature_selection module.
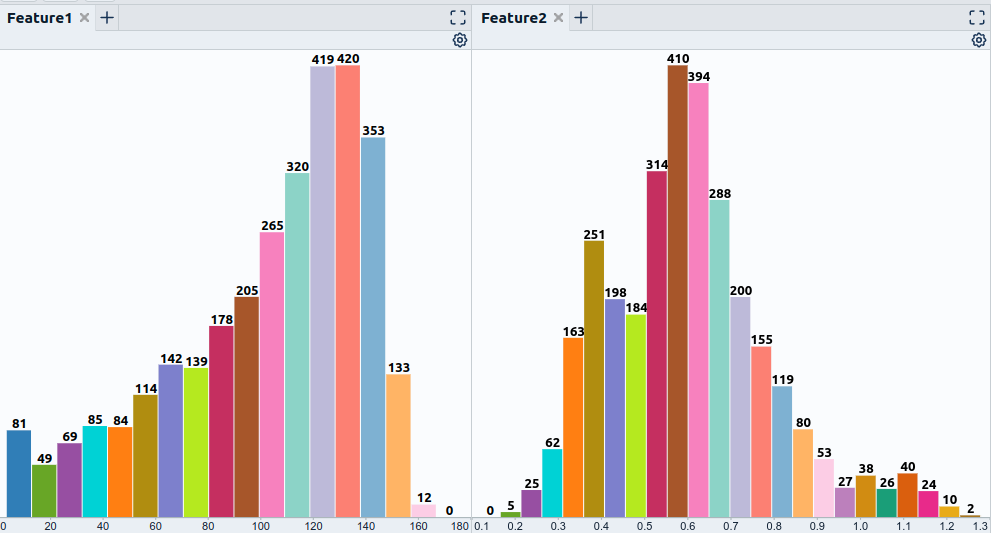
- Tooling to browse the data segment-wise (filter by metadata or use similarity measures and dimensionality reduction) to get a feel for feature characteristics in different scenarios. You can do this with python libraries such as pandas and seaborn for visualizing features (Fig. 3) and complementing approaches such as UMAP for dimensionality reduction.
Conclusion
As shown in our two articles, training condition monitoring models and solving the related data problems can be a tough challenge. We thus hope that our checklist can provide a good starting point for asking the right questions and saves you some time when working on your own Use Case. Also, if we sparked your interest in data curation and Data-centric AI, feel free to contact us.