Motivation
Data collection for condition monitoring has several pitfalls, potentially leading to data that is not suitable for training robust machine learning models. The data problems resulting from the data collection include but are not limited to the presence of failures in the recording equipment, the dominance of specific operating conditions, or mislabeled audio samples.

These circumstances lead to the need to review and clean your collected data, gain insights, and make design decisions regarding the data collection process and the modeling. In this article, we will thus help you to ask the right questions and equip you with a checklist you can use when collecting and preparing data for your condition monitoring use case. In Part 1 of the post, we mainly focus on finding errors and inconsistencies in the data and defining good evaluation data. The second part will focus on the detection of biases and feature selection.
Problem definition and terminology
Before we start to guide you through the data curation process, let's quickly take a step back, define the problem we are looking at, and introduce some terminology. Condition monitoring and predictive maintenance use cases often correspond to a so-called anomaly detection problem. Usually, it is pretty easy to collect a vast amount of data representing normal operating conditions (normal data, samples). The count of those normal samples usually lies in the hundreds or thousands. However, it is not that easy to collect anomalies, either because the cost of collecting them is high, they are rare, or the complete set of anomalies is simply unknown. Often though, few anomalous recordings might be available. Their count usually lies in the ones or tens. Depending on your data collection process, those could either be real anomalies or result from manipulations of the monitored device to provoke some anomaly-like behavior. Some methods can incorporate such anomaly examples to boost performance. They are often referred to as few-shot anomaly detection approaches. Another aspect of the data collection process for anomaly detection is that you can usually collect a vast amount of metadata, e.g., the machine's current operational settings or recording time. You can leverage that data for curating your dataset and potentially incorporate it into your modeling process to boost your model's performance. Note that in some settings, the recorded data could be multimodal. The multimodality potentially adds to the complexity of the problem; however, it also offers opportunities for significant improvements. However, this article will mostly stick to concepts that apply to either unimodal or multimodal data.
Often the data recorded is processed further to extract additional/derived features that one can use for exploration and modeling (Fig. 2). Examples of features that can help exploration are:
- Engineered, interpretable features for anomaly detection and time series classification
- Features derived from metadata, e.g., the duration of an audio recording
- Features coming from pre-trained models that can be used for clustering and navigating the data
- Features learned through unsupervised and self-supervised machine learning methods.
- Outputs of baseline models such as an Autoencoder yielding anomaly scores through its reconstruction error or a OneClass SVM on classical features
Data Curation Checklist
Summary (tl;dr)
- Does the data contain outliers, anomalies, or errors? a. Errors in recording equipment? b. Differences in recording setup? c. Falsely labeled data because of unnoticed defect?
- Does the data contain duplicates? a. Exact duplicates caused by overlapping data sources? b. Near-duplicates caused by overly similar scenarios, like testing sequences of a machine monitored.
- How should the data be split into training, validation, and test sets? a. Duplicates split between train and test data? b. Split is meaningful for the desired generalization? c. All important data segments represented in the evaluation?
- Does training data match production data? Are there unwanted biases? (Part 2) a. Does the training data match the expected production data? b. Are there biases that should not contribute to the decisions of the model?
- Which features are helpful for the task at hand? (Part 2) a. Are there redundant features? b. Are there non-meaningful features that could confuse the model? c. Are there preprocessing options that can simplify the modeling task? d. Which combination of features performs best and is most robust?
Does the data contain outliers, anomalies, or errors?
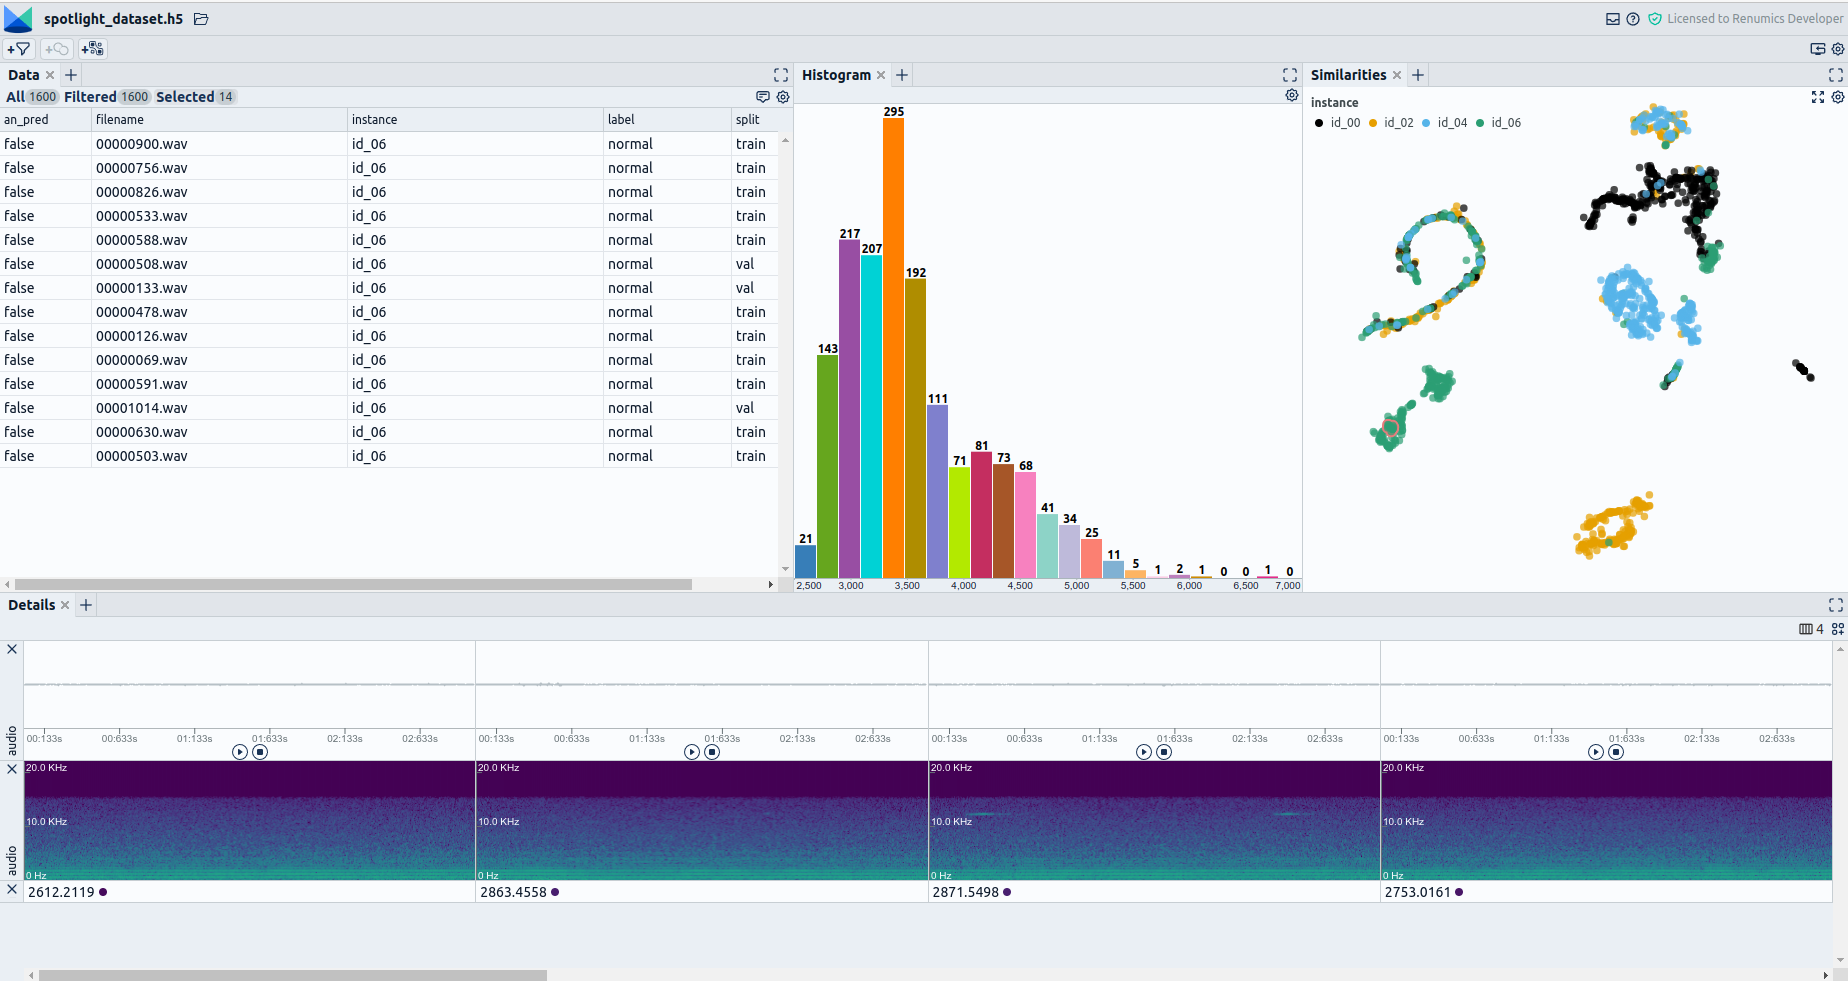
Regardless of how careful the data was acquired, there is the potential for outliers in the data. Those outliers can be problematic when aiming to train a machine learning model. Concrete problems could be poorer model performance, longer training times, or stability issues. Specific types of outliers that you can probably find in your condition monitoring dataset are:
- Global outliers introduced by errors in the recording equipment, e.g., a channel is zero or contains cracking noise.
- Global outliers introduced by differences in the setup, e.g., using a different microphone or recording from another location.
- Contextual outliers introduced by falsely labeled data, e.g., a sample representing a faulty machine that you accidentally saved with the "normal" data. This error could occur because the saving was incorrect, you were not aware of any defect at the time, or the noise of a defective neighboring machine.
When assessing outliers, beware that simply discarding the outliers with automated outlier removal techniques is not feasible. In many scenarios, outliers capture essential information that you should include in your model. E.g., when not including a rare event that appears as an outlier in your "normal" data, the anomaly detector will wrongly detect this event as an anomaly. Thus while outlier detection techniques can help you identify outlier candidates, a qualitative review of those outliers is still required.
Tools that might help you with this task are:
- Tools for getting some suggestions where outliers might be: a. The scikit-learn outlier detection algorithms. b. The PyOD outlier detection library. c. More domain-specific outlier detection methods. For openly published ones, probably check paperswithcode.com.
- Tools for interactively exploring the data and reviewing the automatically suggested outliers (Fig. 3): a. Apache Superset b. Tableau c. Renumics Spotlight d. A combination of python libraries such as pandas, seaborn, Streamlit, Plotly, Dash, and more.
Does the data contain duplicates?
Also, duplicated samples present in the data can cause multiple issues when training your condition monitoring model. Note that when referring to duplicates, I mean identical and near duplicates. Both of them can cause similar problems in practice. One typical problem is the introduction of unwanted bias caused by too many duplicates. Another problem could be non-meaningful evaluation results caused by training data being duplicated in the validation and test data. Some concrete examples of how such outliers could be present in your condition monitoring data are:
- Exact duplicates which are created by using data sources that are not free of overlap. E.g., Copying data from different historical datasets that partly contain the same data.
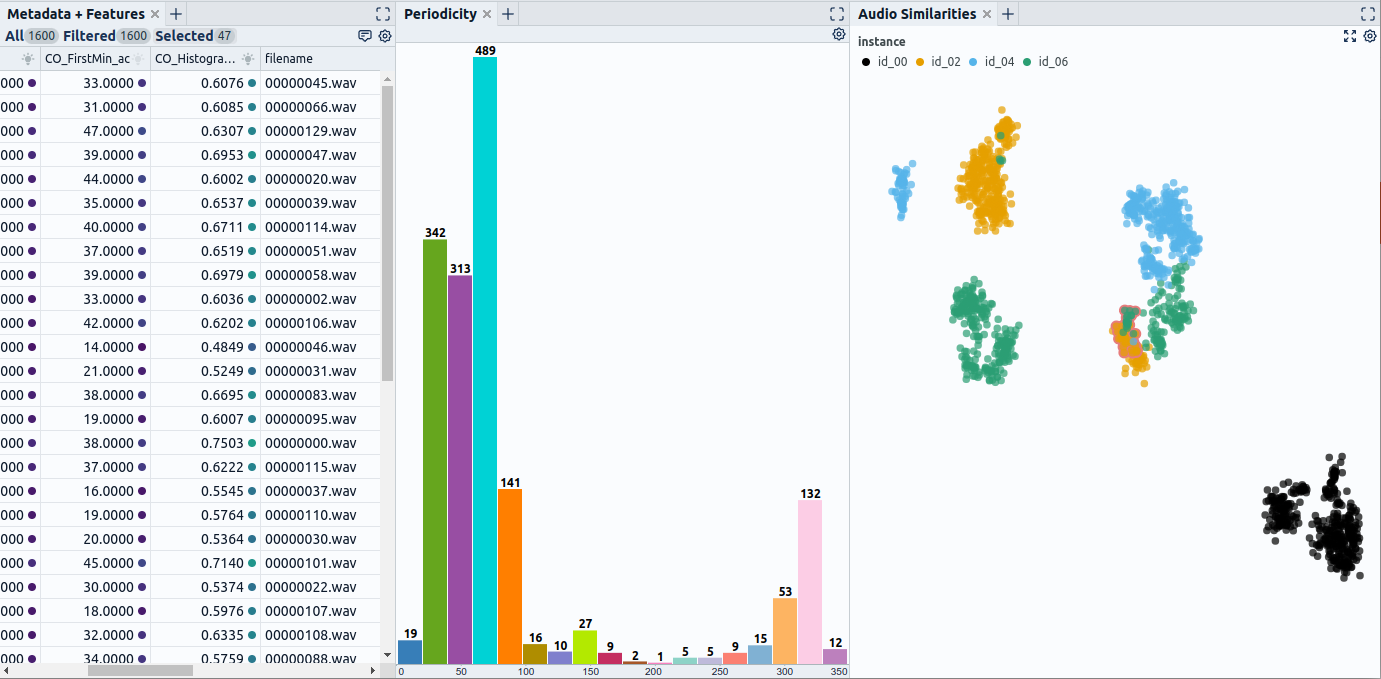
- Near-duplicates caused by recording overly similar scenarios. E.g., your machine runs the identical testing sequence every day, appearing in the recorded data hundreds of times (Fig. 4).
To assess the data for identical duplicates, you can probably rely on simple mechanisms such as those provided by the pandas library over DataFrame.drop_duplicates. When dealing with complex data such as audio recordings in a condition monitoring case and probably struggling with removing near-duplicates, the problem gets much more tricky. A typical solution could build on finding a more suitable representation for matching audio samples according to similarity and use that instead of the raw data. An example of that could be training an autoencoder on the signal's spectrogram and using the created embedding for computing similarities between audio samples. Tools that could be useful for removing duplicates are:
- For metadata or other tabular data: a. Simple functions such as DataFrame.drop_duplicates
- For complex data (Fig. 4): a. Matching functions for different features provided by librosa b. Building an Autoencoder that works on spectrograms via PyTorch or another deep learning framework. c. Use pre-trained models that provide embeddings suitable for matching, e.g., by using the openl3 library.
How should the data be split into training, validation, and test set?
While typical benchmark datasets come with predefined train and test splits, this is not the case when you acquire your own data. Here, it is up to you to decide which splitting may provide you with the most meaningful evaluation. Problems here span the previously described splitting of duplicates between train and validation data to important data segments entirely missing from the evaluation dataset. Concretely, the following issues should be checked for when curating your condition monitoring dataset:
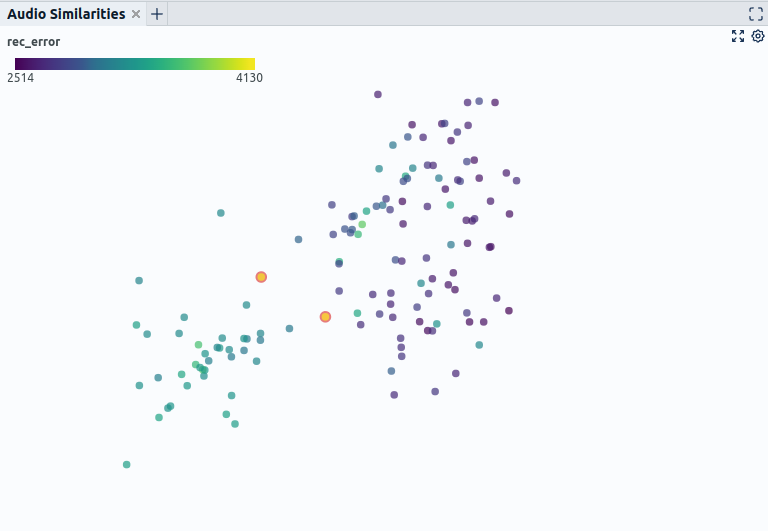
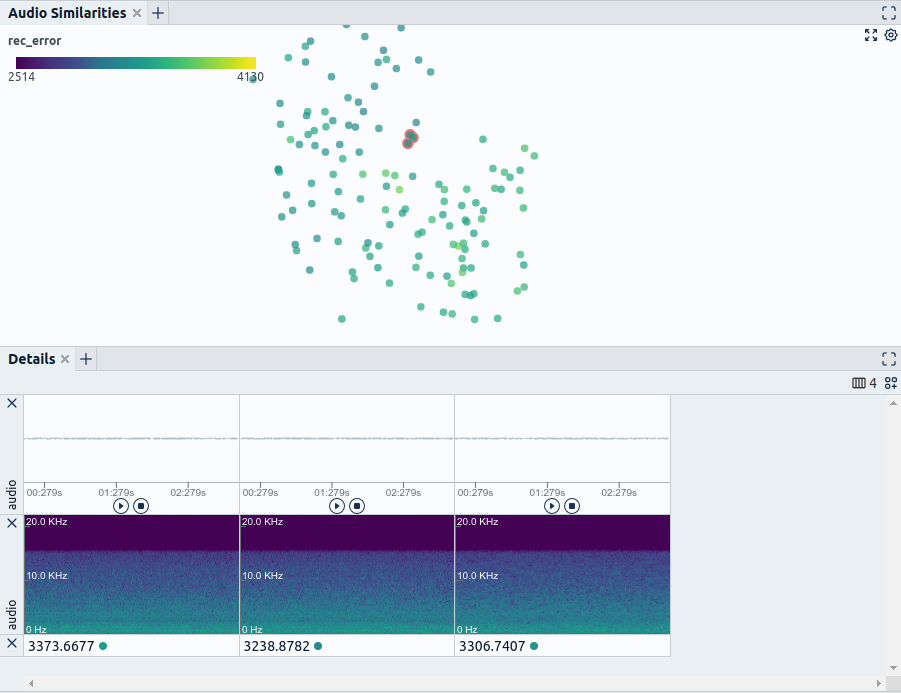
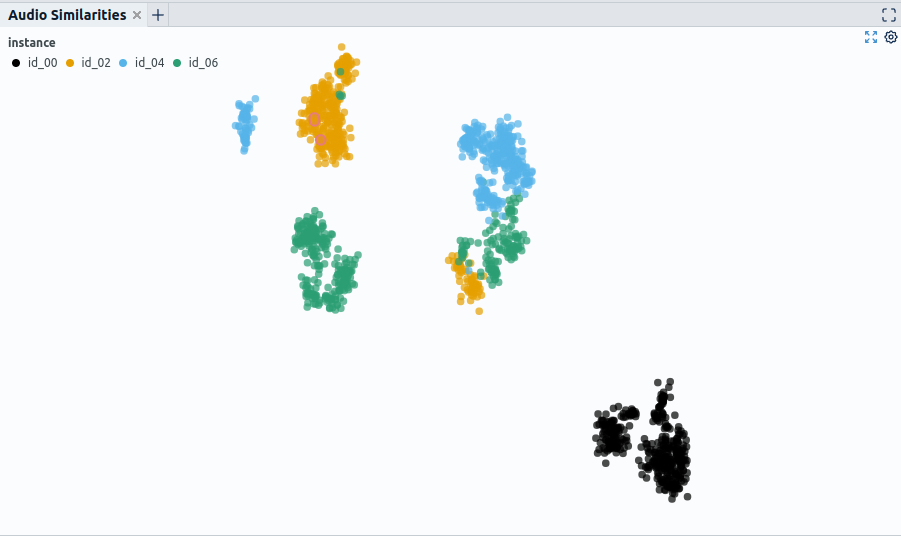
1.Are exact or near-duplicates split between train and validation data causing overly optimistic evaluation results? 2. Which split gives a sufficiently good impression of the desired generalization of the model? E.g., if the goal is that the model generalizes to different machine instances, it is necessary to check to which degree the recordings of different machines are similar. If there is no real difference, one could decide to use random splitting to use all instances in training and test. Suppose, however, that there is an indication that recordings of different machines are substantially different. In that case, one should test thoroughly if a model trained on machines one and two can generalize to machines three and four. This also holds for less apparent differences, such as recording setup, recording time, etc. Partly this can be assessed using metadata such as instance-id or recording time. However, attributes that are not recorded in the metadata could also be necessary for deciding on proper data splitting. Then it can make sense to use representations such as autoencoder embeddings to get a feel for sections that might be "secretly" contained in the data (Fig. 5). 3. Are all critical sections of the data contained in the evaluation set? This especially holds for datasets with rare events, such as often the case in a condition monitoring setting. Even if a particular fault condition or regular machine operating state might be only present in the data a few times, it might be as important as the more frequent states. It is thus essential to include those cases in the evaluation set and potentially pay special attention to them when performing the model evaluation.
Tools and methods that can help answer those questions are, for example:
- Tools to avoid duplicates (see the previous section).
- Exploratory Data Analysis tooling to discover different data sections using metadata such as Apache Superset or Tableau.
- Exploratory Data Analysis tooling that allows for the discovery of hidden patterns by using powerful representations of the raw input data in conjunction with dimensionality reduction techniques such as Renumics Spotlight (Fig. 5).
What to expect in Part 2
In this post, we covered the first three items of our data curation checklist, focusing on errors in the data and the definition of proper evaluation data. In Part 2, we will cover two more important areas. Namely, we will show you which bias-related problems you might have to expect in your condition monitoring use case and what to keep in mind when performing feature selection for your model.