
An Example on Formula 1 Telemetry Data: Unsupervised AI for Time Series Preprocessing
TLDR
When testing vehicles, large amounts of time series data are generated. AI methods can preprocess these data and automatically mark important sections. This can be done with unsupervised learning methods, without the need for labeling and training. Time series data can be analyzed based on similarity to structure the data and provide interactive visualizations for the user.
 Animation of UMAP [1] dimensionality reduction for Formula One race telemetry data (RPM); the reduction is updated with each new lap’s data — created by the author
In the animation, such a similarity-based analysis is illustrated using telemetry data from a Formula 1 race. After each completed lap, all data from previous laps are evaluated and points are calculated based on the similarity map for their RPM profiles. Over time, patterns become visible, which can be used to identify unusual events that can then be inspected in more detail.
Introduction: Challenges in Automotive Testing
Testing is essential for the development of safe and comfortable vehicles. However, the measurement and telemetry data generated from the CAN-Bus, as well as sensor data and audio recordings, are very extensive due to the many channels, long measurement times and numerous test variations. Efficient evaluation of data from various test procedures in areas such as NVH (Noise, Vibration and Harshness), drivetrain, E/E Integration (electrical and electronic integration), ADAS (Advanced Driver Assistance Systems) or passive safety is important for rapid vehicle development.
AI based Solutions for Automotive Testing
Sometimes simple, rule-based methods are sufficient to preprocess data automatically and reduce workload. But usually, manual, experience-based work is necessary to find unusual events. This can be shortened through automatic preprocessing. Two AI approaches for test data evaluation can be distinguished to find candidate events and sort them by their relevance:
Supervised AI methods: If already evaluated data with labels for occurred events are available, it can be useful to train a supervised AI method to detect specific events like brake squeal in the data.
Unsupervised AI methods: These methods can structure the data without labeling and training.
-
Clustering: Here, similar data points are grouped into clusters. This helps to efficiently use commonalities in the data, for example, by only examining a few representative members of each cluster to save time.
-
Dimension reduction: Dimension reduction methods like UMAP can be used to project high-dimensional data into a low-dimensional representation. For example, time sequences can be interpolated and projected into a 2D image with UMAP to create an illustrative visualization. Local and global structures are preserved as much as possible.
Dimension Reduction for Automotive Testing: An Example on Formula 1 Telemetry
The process for dimension reduction can be replicated with a few lines of code:
First, set up the environment: start a Jupyter Notebook and install the necessary Python packages:
!pip install fastf1 pandas umap-learn renumics-spotlight
The following packages are used:
-
FastF1: Python library for easy access to historical F1 data — including telemetry and race results.
-
Pandas: Python library for data analysis.
-
umap-learn: Python library for dimensionality reduction that projects high-dimensional data into low-dimensional representations while preserving local and global data structures.
-
Renumics-Spotlight: Tool for interactive visualization of structured and unstructured data.
First, the data of the race is loaded via the FastF1 interface:
import fastf1
session = fastf1.get_session(2023, "Montreal", "Race")
session.load(telemetry=True, laps=True)
Now, each lap for every driver can be queried as a DataFrame. This includes, among others:
-
Driver: Driver of the vehicle
-
LapNumber: Number of current lap
-
Speed (time series): Speed
-
Throttle (time series): Throttle position
-
Brake (time series): Use of the brake
-
RPM (time series): Engine speed
-
X (time series): The X-coordinate indicating the position of the vehicle on the track
-
Y (time series): The Y-coordinate indicating the position of the vehicle on the track
The data is then initially converted with
def dataframe_to_dict(df):
    """Converts a pandas DataFrame to a dictionary of lists.
    If a column has only one unique value, it is converted to a scalar."""
    result = {}
    for col in df.columns:
        unique_values = df[col].unique()
        result[col] = df[col].tolist() if len(unique_values) > 1 else unique_values[0]
    return result
into individual dictionaries for telemetry and general information. The time series are converted into lists:
# Load lap info and telemetry and telemetry as list of dicts
df_laps_telemetry, laps = [], []
for _, lap in session.laps.iterlaps():
    df_laps_telemetry.append(lap.get_telemetry())
    laps.append(lap.to_dict())
Now all dicts are used to create
# create a new DataFrame with one row for each lap of each driver
import pandas as pd
data = [dataframe_to_dict(tele) | lap for lap, tele in zip(laps, df_laps_telemetry)]
df = pd.DataFrame(data)
a large DataFrame:
| Date | Driver | LapNumber | Speed | RPM | Brake | X | ... | |
|---|---|---|---|---|---|---|---|---|
| 0 | [Timestamp('2023-06-18, ...] | VER | 1 | [0, 0, 0, ...] | [9812, 9753, ... ] | [False, False, ...] | [3299, 3300, ...] | |
| 1 | [Timestamp('2023-06-18, ...] | VER | 2 | [278, 278, ...] | [11033, 11045, ...] | [False, False, ...] | [3356, 3374, ...] | |
| 2 | [Timestamp('2023-06-18, ...] | VER | 3 | [279, 280, ...] | [11008, 11007, ...] | [False, False, ...] | [3356, 3376, ...] |
To simplify the further steps, data series that need to be analyzed are interpolated
import numpy as np
def interpolate_column(values):
    """Interpolates a list of values to a fixed length of 882."""
    x = np.linspace(0, 1, 882)
    xp = np.linspace(0, 1, len(values))
    return np.interp(x, xp, values)
to the same length:
df["Speed_emb"] = df["Speed"].apply(interpolate_column)
df["RPM_emb"] = df["RPM"].apply(interpolate_column)
After that, their dimensions can be reduced:
import umap
import numpy as np
embeddings = np.stack(df["Speed_emb"].to_numpy())
reducer = umap.UMAP()
reduced_embedding = reducer.fit_transform(embeddings)
df["Speed_emb_umap"] = np.array(reduced_embedding).tolist()
The result can be displayed and used for exploration with appropriate visualization tools. In this example, Renumics-Spotlight used
import pandas as pd
from renumics import spotlight
spotlight.show(df, dtype=\{"Speed": spotlight.Sequence1D\}, port=5436)
to start an interactive visualization of the DataFrame:
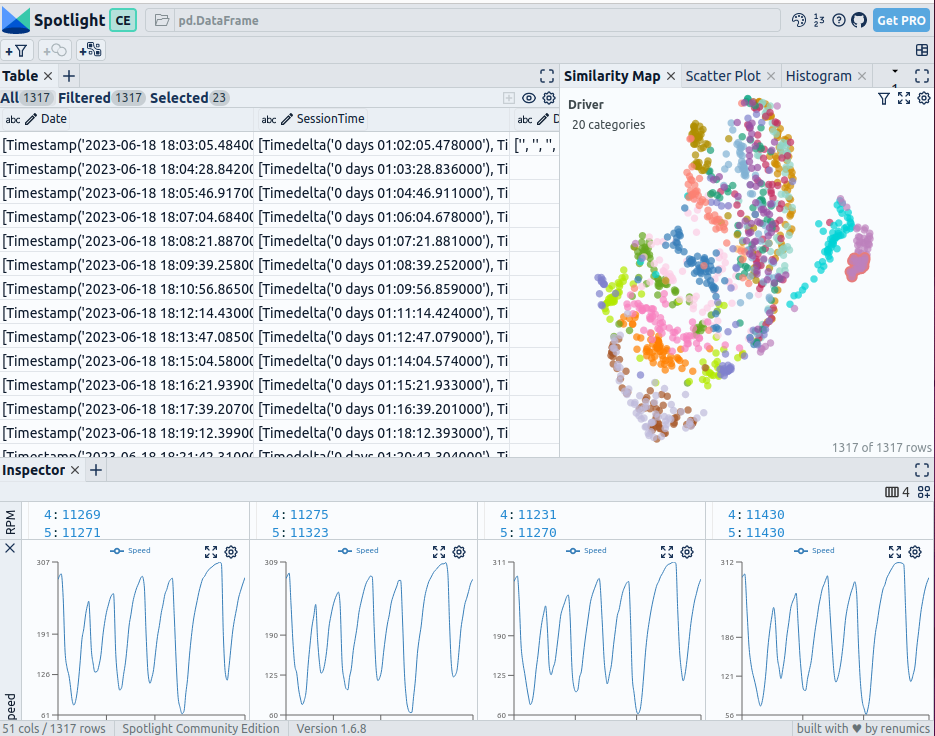 Interactive visualization of the Formula 1 race data with Renumics Spotlight — image created by the author
In the table on the left, the DataFrame is displayed. You can use the “visible columns” button to control which columns are shown in the table. The similarity map is shown in the top right. Selected data points are displayed at the bottom, where the speed profile is plotted.
Extended Example Online
In our demo space on Hugging Face, we have created another example that, in addition to the time series, includes a visualization of the track layout with color-coded representations for speed and gear, as well as portraits of the individual drivers:
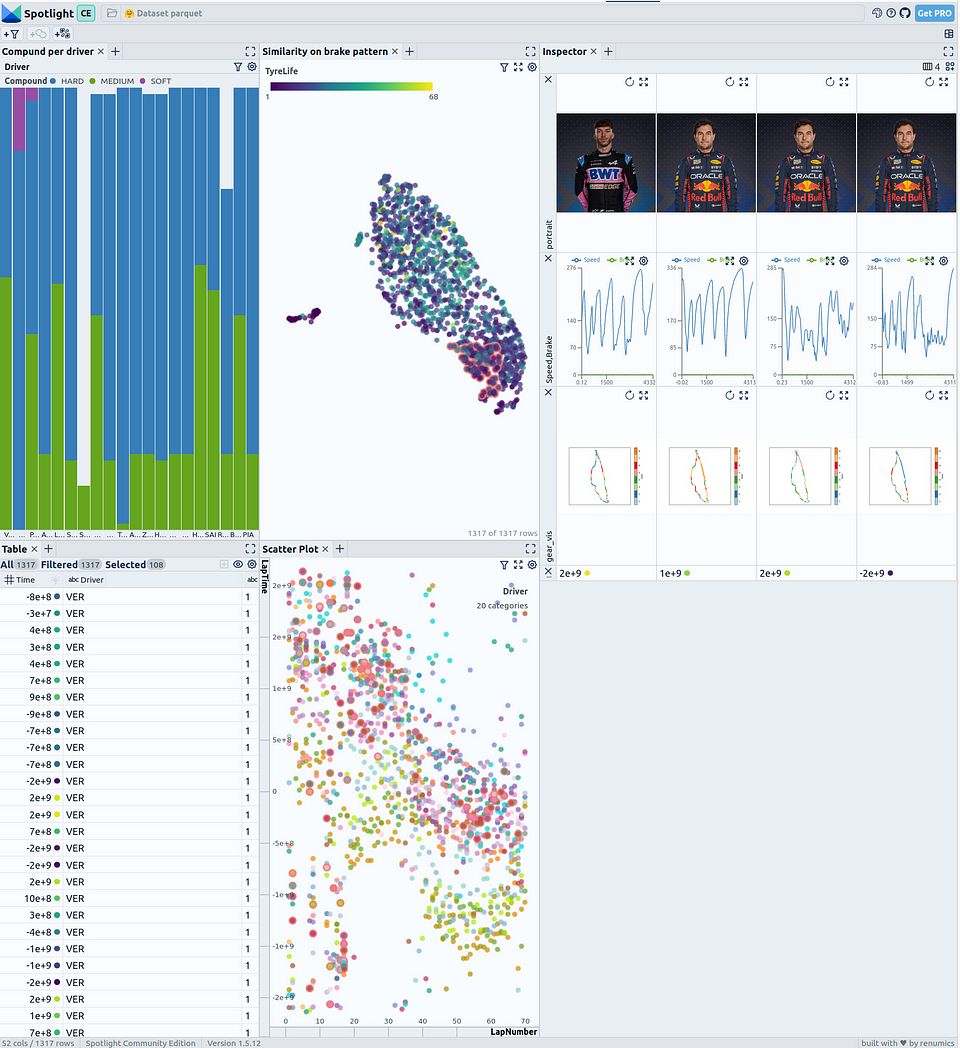 Screenshot of the Formula 1 Demo Space on Hugging Face — image created by author
With the visualization of the track layout, the vehicle data from the race can be analyzed more easily. The color-coded representation of speed and gear allows critical points on the track and the different strategies of the drivers to be identified.
Summary
The use of AI methods for semi-automatic evaluation of test data in the automotive sector offers significant advantages. Unsupervised learning methods such as clustering and dimensionality reduction enable the efficient analysis of large time series data sets by automatically marking relevant sections. This helps to identify unusual events more quickly and can accelerate the development process.
The example of Formula 1 telemetry data shows how test data can be structured and visually processed through dimensionality reduction.
References
[1] Leland McInnes, John Healy, James Melville: UMAP: Uniform Manifold Approximation and Projection for Dimension Reduction (2018), arXiv