tl;dr
If you work in ML-based acoustics, the annual DCASE challenge is a great resource to learn about new state-of-the-art methods. Task 2 of this challenge deals with anomalous sound detection for machine condition monitoring. We built a dataset for this challenge that contains baseline results and transformer embeddings. You can download it from Huggingface and explore it with Spotlight in just 5 minutes.
DCASE23 Task2 challenge and dataset
Once a year, the DCASE community publishes a challenge with several tasks in the context of acoustic event detection and classification. Task 2 of this challenge deals with anomalous sound detection for machine condition monitoring. The original dataset is based on the MIMII DG and the ToyADMOS2 datasets. The enrichments include an embedding generated by a pre-trained Audio Spectrogram Transformer and results of the official challenge baseline implementation.
Motivation for enriched benchmark datasets in condition monitoring
Data-centric AI principles have become increasingly important for real-world use cases. At Renumics we believe that classical benchmark datasets and competitions should be extended to reflect this development.
This is why we are publishing benchmark datasets with application-specific enrichments (e.g. embeddings, baseline results, uncertainties, label error scores). We hope this helps the ML community in the following ways:
- Enable new researchers to quickly develop a profound understanding of the dataset.
- Popularize data-centric AI principles and tooling in the ML community.
- Encourage the sharing of meaningful qualitative insights in addition to traditional quantitative metrics.

Dataset exploration
The enrichments allow you to quickly gain insights into the dataset. Renumics Spotlight enables that with just a few lines of code:
Install datasets and Spotlight via pip:
pip install renumics-spotlight datasets[audio]
Notice: On Linux, non-Python dependency on libsndfile package must be installed manually. See Datasets - Installation for more information.
Load the dataset from huggingface in your notebook:
import datasets

dataset = datasets.load_dataset("renumics/dcase23-task2-enriched", "dev", split="all", streaming=False)
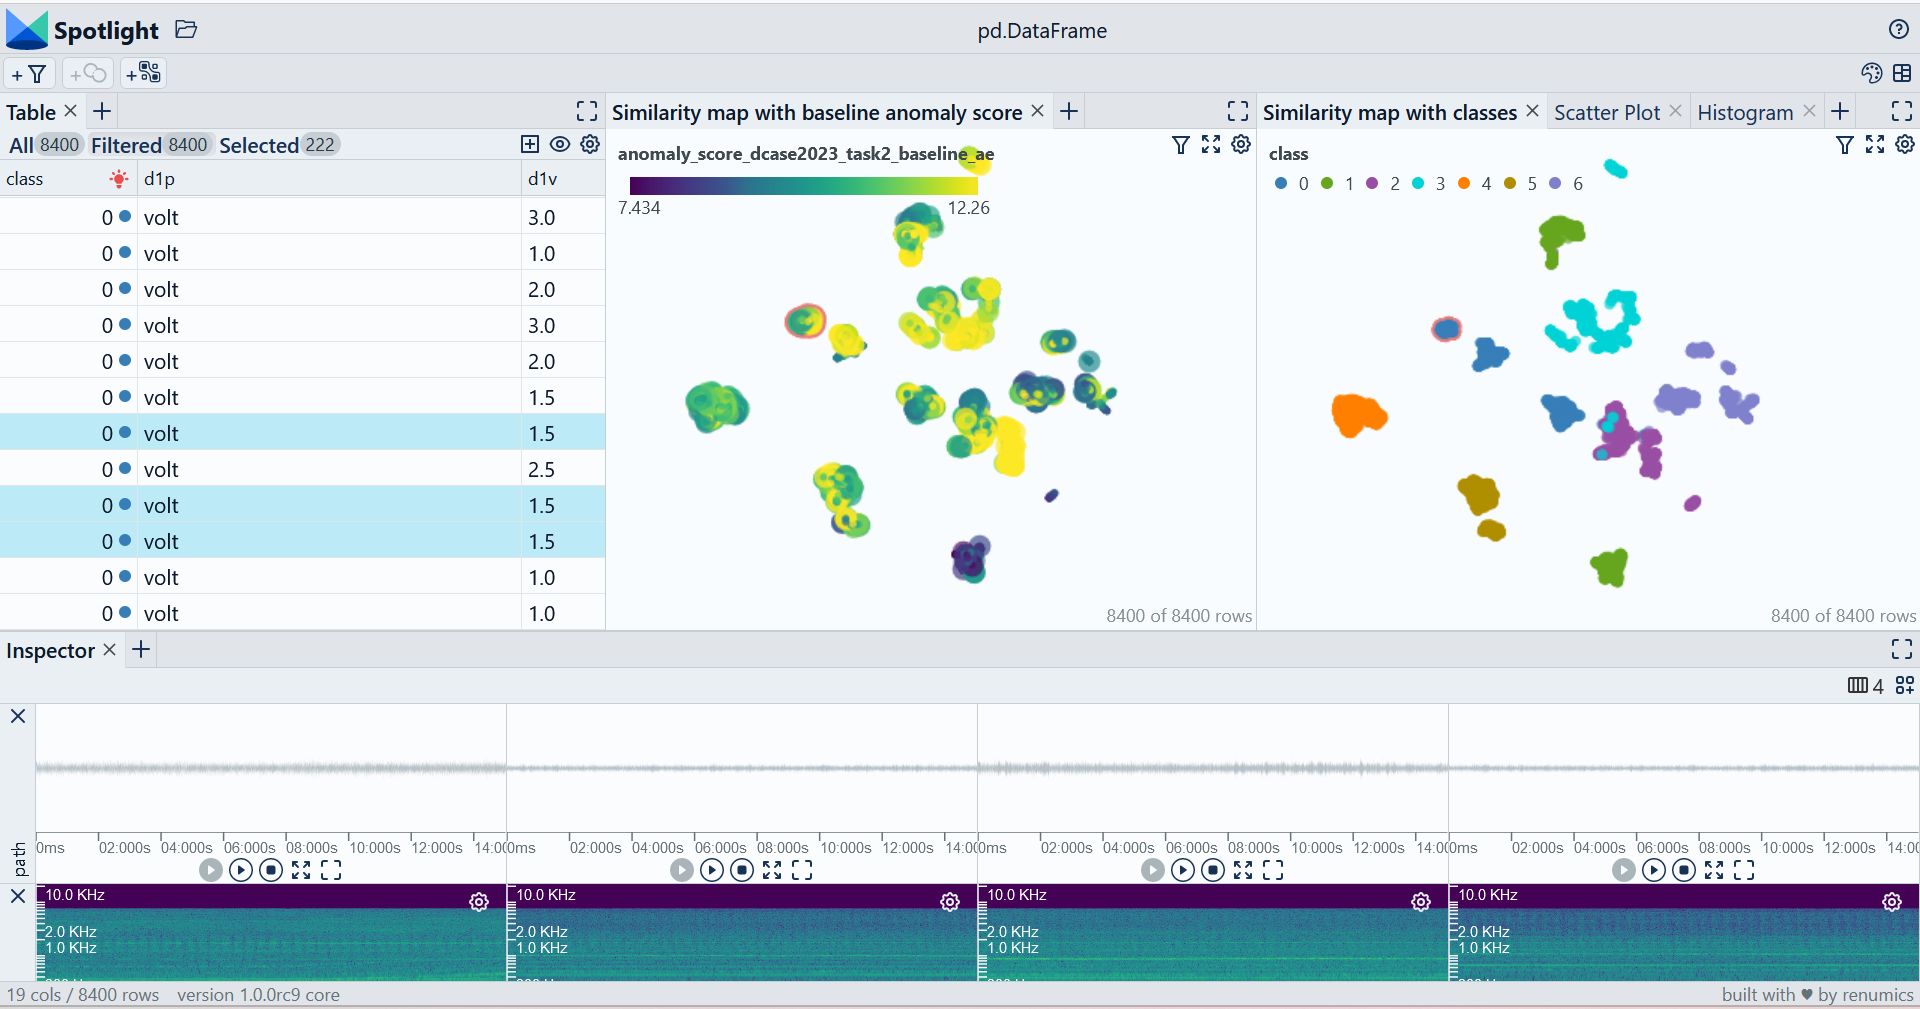
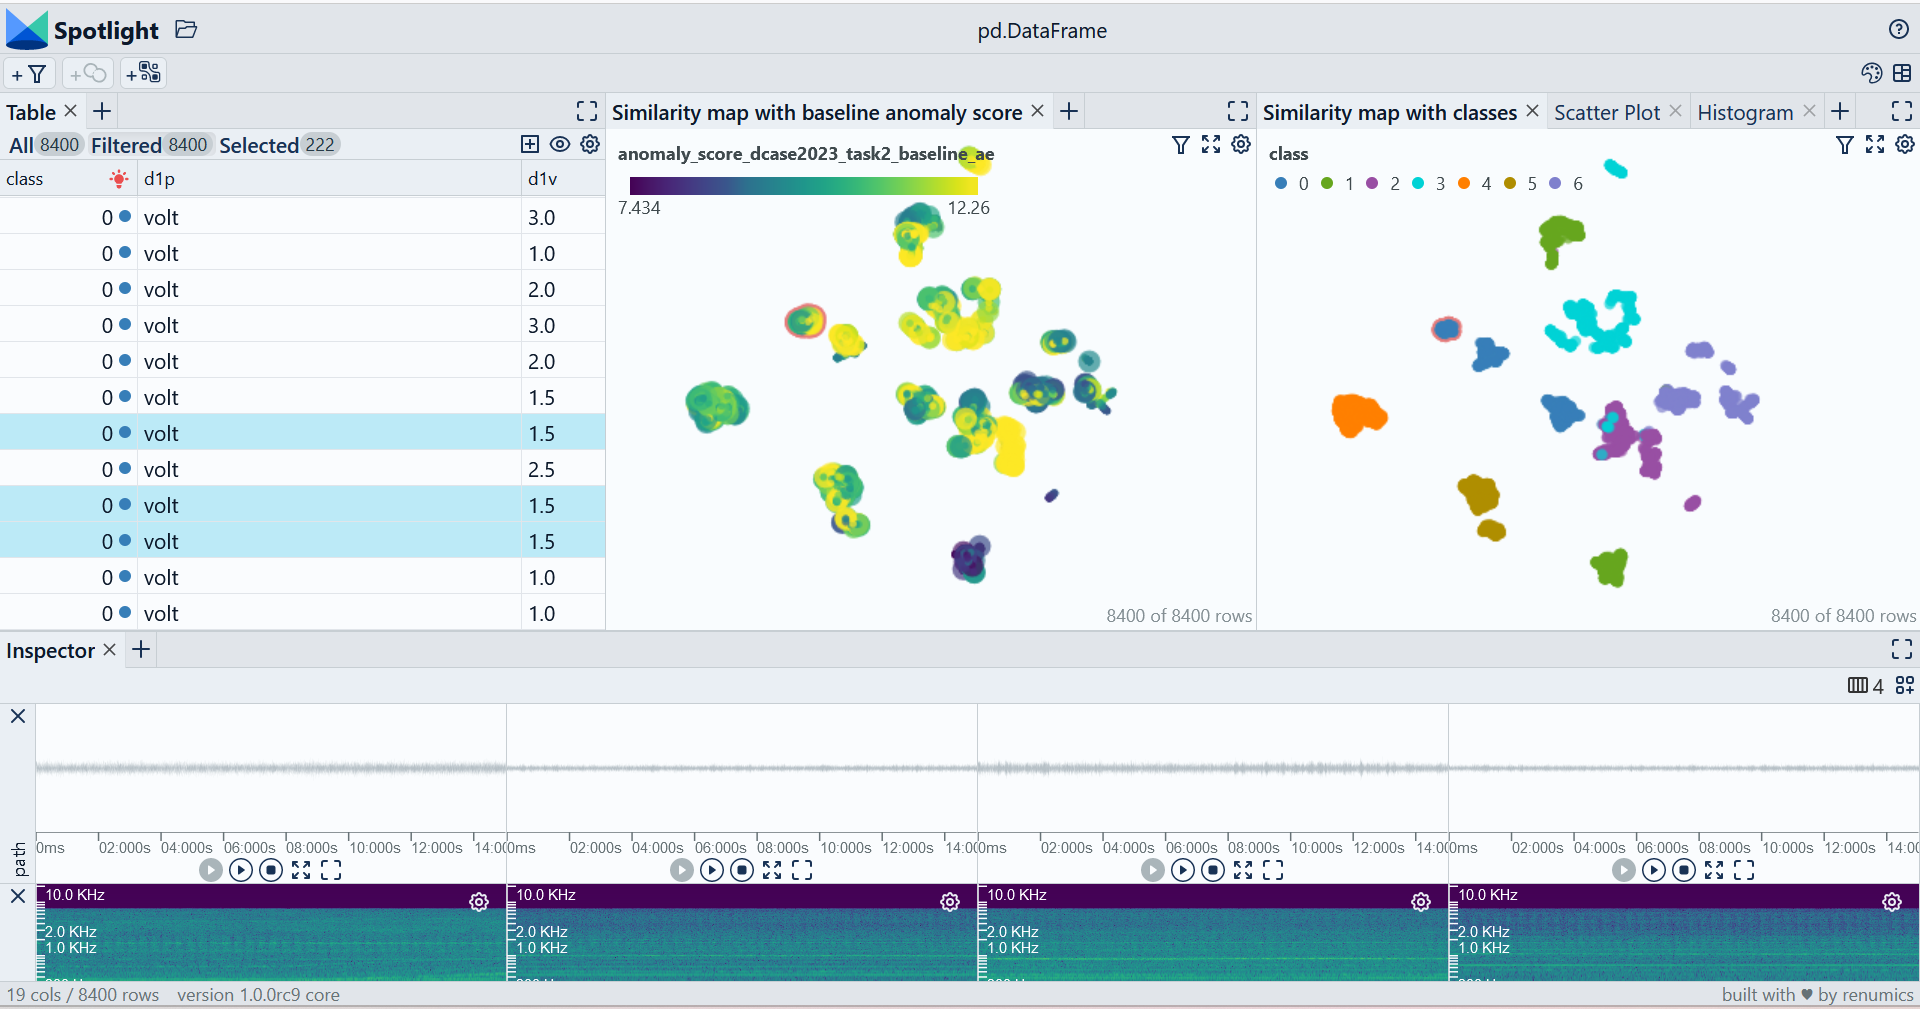
Start exploring with a simple view that leverages embeddings to identify relevant data segments:
from renumics import spotlight

df = dataset.to_pandas()
simple_layout = datasets.load_dataset_builder("renumics/dcase23-task2-enriched", "dev").config.get_layout(config="simple")
spotlight.show(df, dtype={'path': spotlight.Audio, "embeddings_ast-finetuned-audioset-10-10-0.4593": spotlight.Embedding, "embeddings_dcase2023_task2_baseline_ae": spotlight.Embedding}, layout=simple_layout)
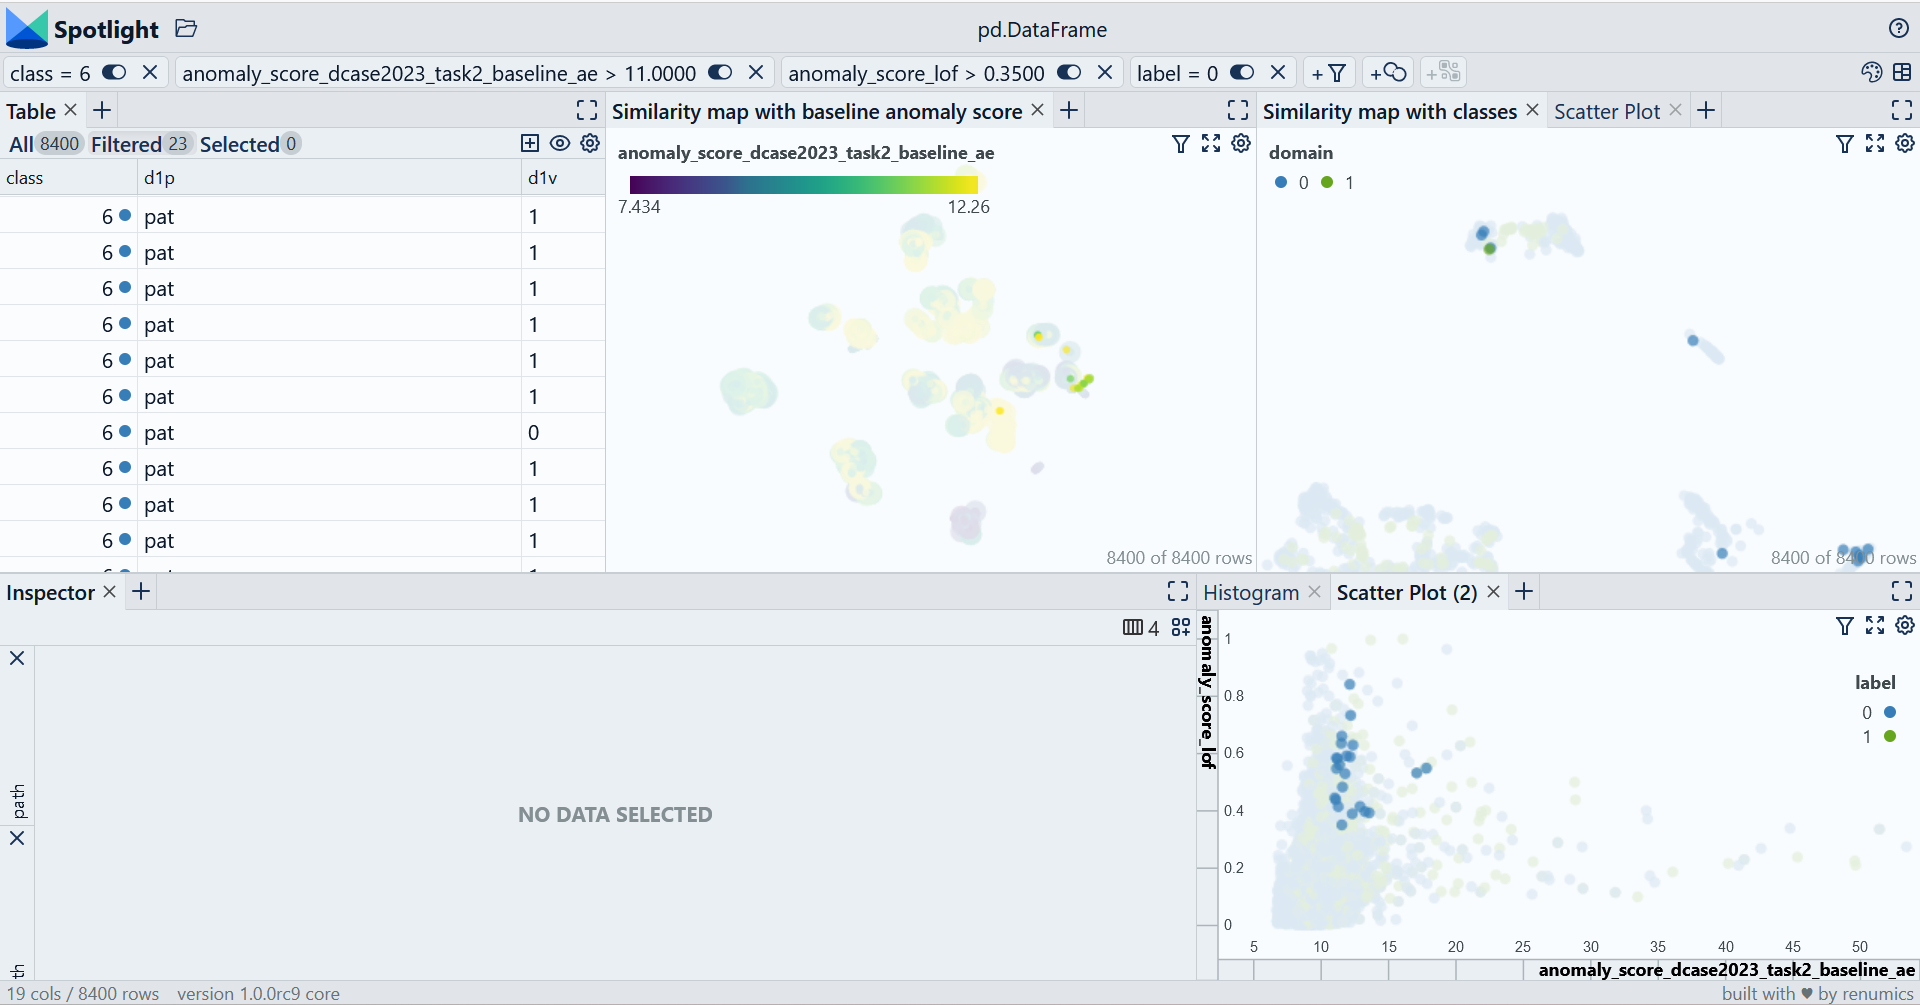
You can use the UI to interactively configure the view on the data. Depending on the concrete taks (e.g. model comparison, debugging, outlier detection) you might want to leverage different enrichments and metadata.
In this example we focus on the valve class. We specifically look at normal data points that have high anomaly scores in both models. This is one example on how to find difficult example or edge cases:
from renumics import spotlight

extended_layout = datasets.load_dataset_builder("renumics/dcase23-task2-enriched", "dev").config.get_layout(config="extended")
spotlight.show(df, dtype={'path': spotlight.Audio, "embeddings_ast-finetuned-audioset-10-10-0.4593": spotlight.Embedding, "embeddings_dcase2023_task2_baseline_ae": spotlight.Embedding}, layout=extended_layout)

Using custom model results and enrichments
When developing your custom model for the challenge you want to use different kinds of information from you model (e.g. embedding, anomaly scores etc.) to gain further insights into the dataset and the model behvior.
Suppose you have your model's embeddings for each datapoint as a 2D-Numpy array called embeddings and your anomaly score as a 1D-Numpy array called anomaly_scores. Then you can add this information to the dataset:
df['my_model_embedding'] = embeddings
df['anomaly_score'] = anomaly_scores
Depending on your concrete task you might want to use different enrichments. For a good overview on great open source tooling for uncertainty quantification, explainability and outlier detection, you can take a look at our curated list for open source data-centric AI tooling on Github.
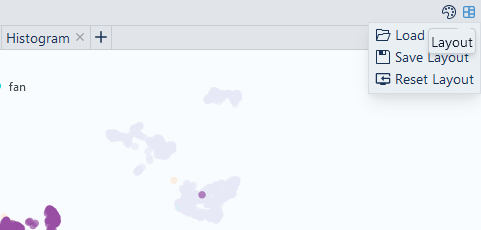
You can also save your view configuration in Spotlight in a JSON configuration file by clicking on the respective icon:

For more information how to configure the Spotlight UI please refer to the documentation.
