We have just released the open version of our data curation software Renumics Spotlight. It is intended for cross-functional teams who want to be in control of their data and data curation processes. In this post I would like to share our ideas behind this product.
Since we started our first deep learning projects in 2017, the understanding of the technology and its applications has come a long way. Everybody now understands a lot better how to conceptualize data-driven solutions, how to build effective development teams and how to educate and inspire users.
Within the last five years, there have been two big waves in terms of development tooling for machine learning: The first wave was MLOperations (MLOps). Tools and frameworks were built to track trainings, manage deployments, and monitor production models. The second wave was data-centric AI (DCAI). When Andrew Ng coined this term in 2021, this immediately struck a chord in our team. We knew from our own experience that deeply understanding and optimizing the training data was the key for good data-driven solutions.
Data-centric AI: New wine into old wineskins?
Many experienced data scientists expressed skepticism towards the DCAI movement. In their view the approach just mimics a decade-old reality and should be seen as more of a wakeup call for academia. We felt differently. Most projects we saw still had a very waterfall-like structure: Annotate the data, do feature selection, perform hyperparameter tuning, deploy model. Most people were still only talking about quantitative metrics such as F1-scores and not about data segments and failure modes.
At the same time, advances in self-supervised learning and explainable AI as well as the availability of pre-trained models offered a much better approach to ML on unstructured data: By running some inferences and simple trainings, it became possible to enrich a given dataset with additional information such as similarities, uncertainty scores or feature importances. These enrichments are invaluable for understanding the problem space, identifying model failures and improving the training data.
However, we found that these techniques were typically not used to their fullest potential (if at all!) by most teams we talked with. This was fascinating as understanding data or data quality frequently comes up as one of the most important success factors for ML-based solutions in our surveys. Why is that?
We found that the biggest reason is lack of time. Most importantly, teams don’t have time to manually crawl through a lot of data. This especially applies to domain experts, who typically are in a supporting role in a project and still have a day job as their main priority. Both data as well as domain experts would like to have better tools that reduce this kind of work. However, these tools are usually not available as building, improving and maintaining them is considered too much work. Let’s have a closer look at that.
State of the art in data curation tooling
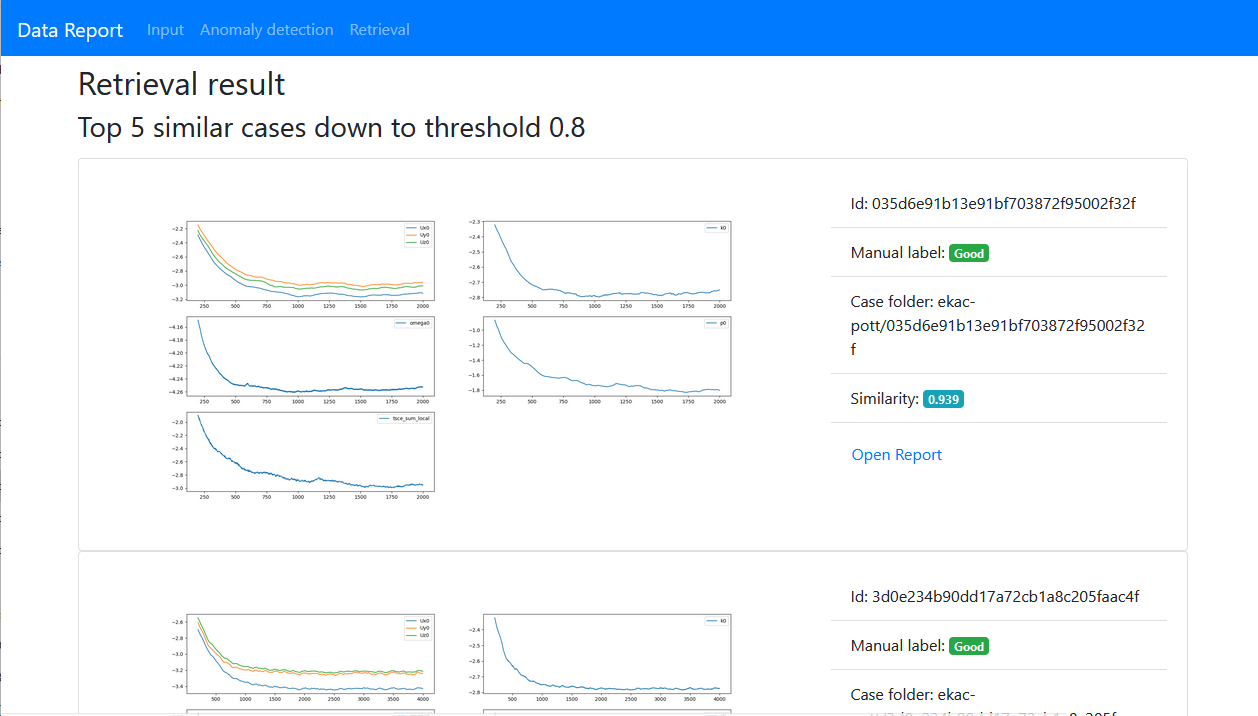
Tooling to visualize, explore, understand and curate unstructured datasets has evolved substantially over the last five years. In the beginning, we used to generate semi-interactive HTML reports that we could share between stakeholders. We found that many teams still use similar processes based on Matplotlib and PDF documents. While these kinds of reports can convey the most important metrics and some qualitative insights (e.g. worst false positives), they do very little to systematically uncover model failure modes and critical data segments.
Interactive Python-based dashboards
A good option to make such reports more interactive are Python-based toolkits such as Streamlit or Plotly/Dash: They allow to prototype nice dashboards and simple GUIs in a couple of hours (no Javascript knowledge necessary). They are especially useful if you know exactly what kind of dashboard to build.
However, this is typically not the case for many data curation tasks. In contrast, the demands on the data visualization and curation capabilities evolve over an ML project. In practice, this manifests as a feature creep on the dashboard implementation. If this goes on for a while, simple dashboard solutions eventually fall off a cliff when the application becomes bloated and un-maintainable.
Dedicated data curation tooling
To provide a better experience for both data and domain experts, several dedicated data curation tools have emerged over the last two years. These solutions typically focus on a specific domain (e.g. NLP, computer vision) and provide specialized interfaces for concrete tasks in the data curation process: Model evaluation, duplicate removal etc.
Such tools make use of model data (e.g. embeddings) to quickly generate insights. They run in the cloud which facilitates collaboration between different stakeholders. They are also very easy to set up and to maintain.
However, they also force ML teams to relinquish control over key aspects of their data curation process and their data:
-
User interfaces and interaction workflows are non-customizable: This means innovative data enrichments and curation ideas can’t be directly implemented. This is crucial as the data-centric AI space is evolving fast and many applications have specialized data curation needs. As datasets are becoming increasingly complex and multimodal, adaptive user interfaces are essential.
-
Data enrichment and quality scores are proprietary: Some platform offer automated capabilities to compute enrichments (e.g. embeddings, feature importances) or data quality scores. While this can be a good thing in terms of convenience, we believe that such algorithms must be open so data teams can fully understand what is going on.
-
Data must be uploaded to the cloud: Not only require most tools to at least upload metadata to the cloud, but they also introduce custom dataset formats. This means that existing data management infrastructure must be extended or replaced.
Bringing data-centric AI to every ML stack
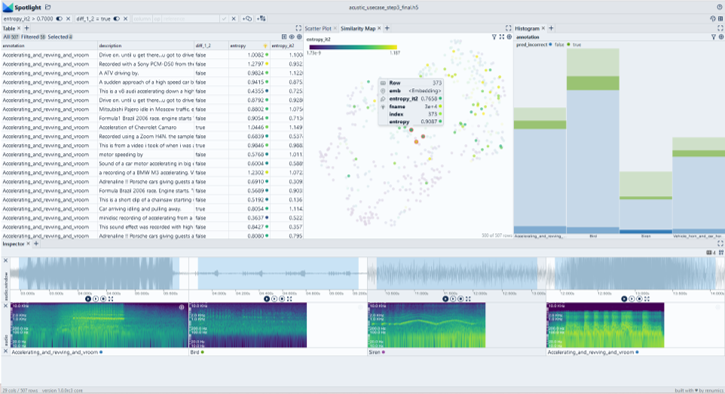
With Spotlight, we are building a data curation tool for teams that want to be in control of their data and data curation processes. At the same time, Spotlight workflows are easy to learn and easy to maintain. We achieve this by providing a unique abstraction layer for data curation tasks: Spotlight is essential an interactive data exploration tool that is optimized for finding and tagging segments in unstructured data. For this purpose, Spotlight leverages data enrichments either based on model output (e.g. embeddings, uncertainties, feature importances) or based on existing methods (custom features, rules).
We envision Spotlight to be the data curation component in a modular ML stack. To achieve that, we want to provide seamless integrations into existing workflows. Here, the support for data management and annotation tooling is especially important. We already have a good starting point based on the Pandas dataframe interface and we will build more integrations over the coming months.
To facilitate the open nature of Spotlight, we are also launching an open core version. We feel that this is the best way to embed Spotlight into the growing data-centric AI ecosystem.
Learn more and get in touch
If you would like to learn more about Spotlight or try it right away, then check out our Github or our docs
If you would like to share some feedback or other ideas, I’d be very happy to have a virtual coffee with you.