Analyze formula1 race data
First install the dependencies:
pip install renumics-spotlight fastf1
Loading the data with the fastf1 library
We load data from the F1 Montreal 2023 GP through the FastF1 library:
import fastf1

session = fastf1.get_session(2023, 'Montreal', 'Race')

session.load(telemetry=True, laps=True)

laps = session.laps
We want to analyze the data on a per-lap basis. The fastf1 library provides an API that does the necessary slicing and interpolation. We use this API to extract the sequences for Speed, RPM etc. per lap.
import numpy as np
import pandas as pd
from tqdm import tqdm

def extract_telemetry(laps, columns):
    df_telemetry = pd.DataFrame(columns=columns)
    row_dict = {}

    for index, lap in tqdm(laps.iterlaps(), total=laps.shape[0]):
        telemetry = lap.get_telemetry()
        for column in columns:
            row_dict[column] = [telemetry['Distance'].tolist(), telemetry[column].tolist()]
        df_telemetry.loc[index]=row_dict

    return df_telemetry

columns = ["DistanceToDriverAhead", "RPM", "Speed", "nGear", "Throttle", "Brake", "DRS", "X", "Y", "Z"]
df_telemetry = extract_telemetry(laps, columns)
We save the telemetry data as a Python list of list. This format is compatible with PyArrows. This means we can save the dataset as .parquet or we can convert it to a Hugging Face dataset. A 2D Numpy array is not supported by PyArrows.
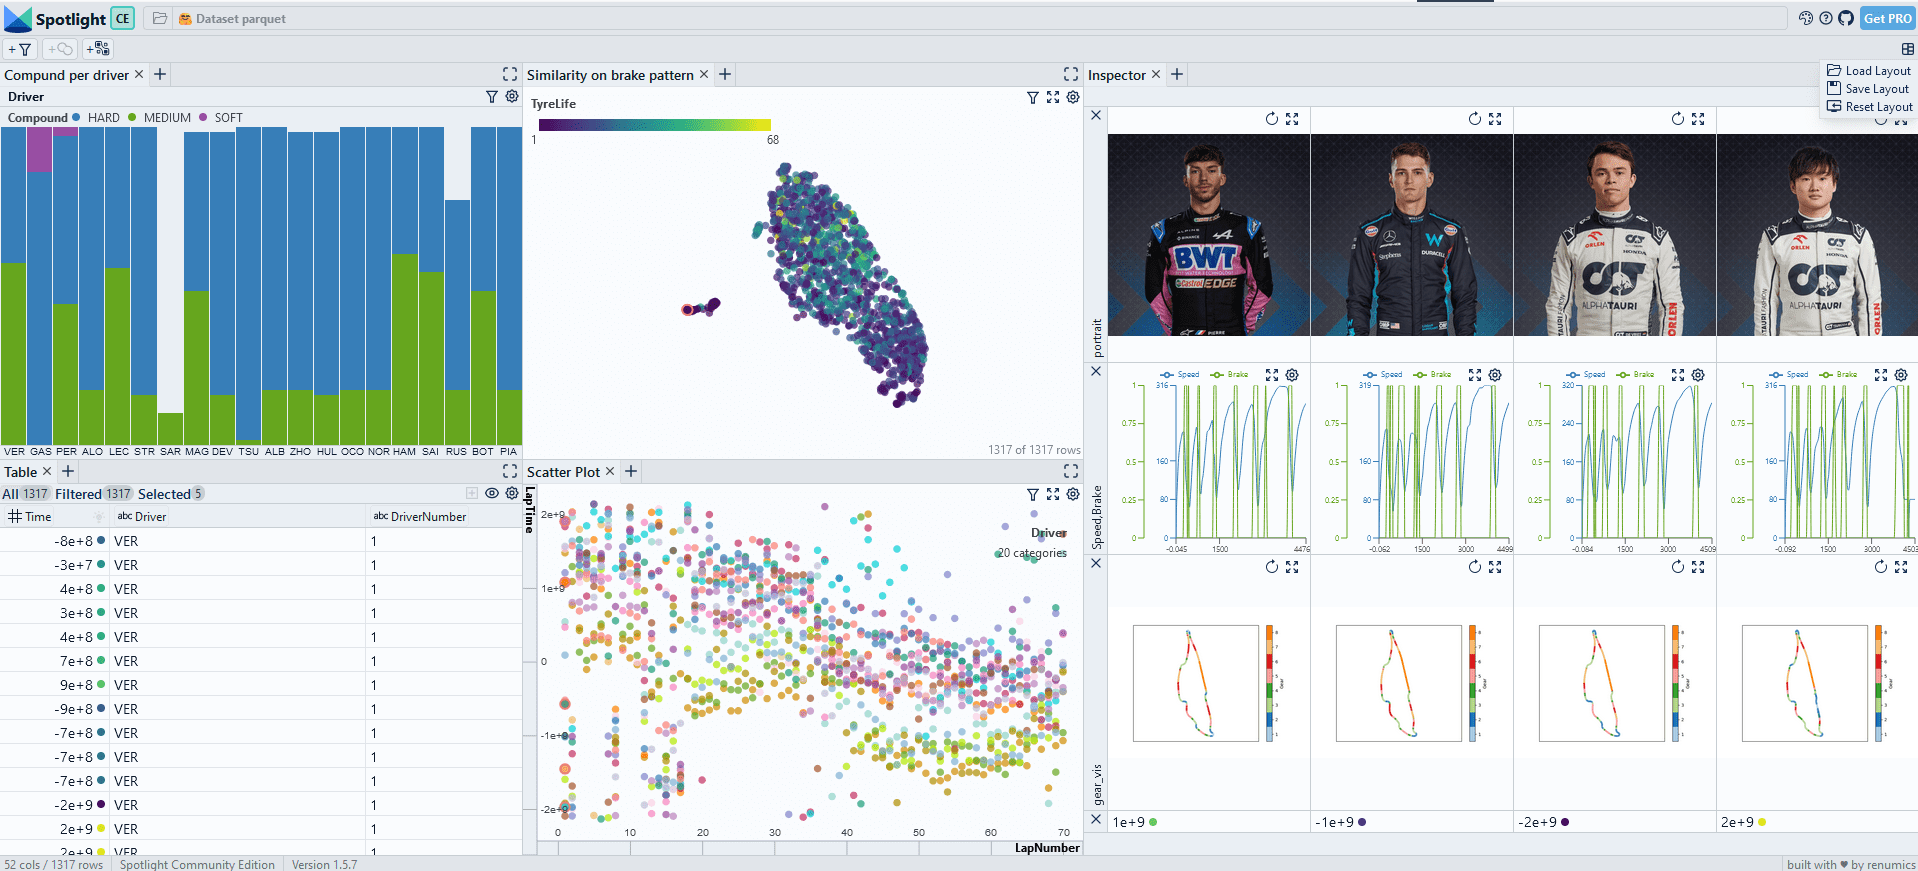
Visualize with Spotlight
We concatenate the dataframes:
#concat the dataframes
df_metadata = pd.DataFrame(laps)
df = pd.concat([df_metadata, df_telemetry], axis=1)
And visualize the data in Spotlight:
from renumics import spotlight

spotlight.show(df)
Memory-efficient saving and loading time series data
Saving and loading time series data with Pandas
For datasets that easily fit into memory, Pandas-based data formats work very well. We can save the dataset as a Parquet file:
df.to_parquet('f1telemetry.parquet.gzip', compression='gzip')
We can then load back from this file. When measuring the memory footprint
import pandas as pd
import psutil

print('memory used in MB:', psutil.virtual_memory()[3]/ 1024 ** 2)
df = pd.read_parquet('f1telemetry.parquet.gzip')
print('memory used in MB:', psutil.virtual_memory()[3]/ 1024 ** 2)
we find that the dataset uses approximately 300MB of RAM.
Saving and loading time series data with Hugging Face / PyArrows
We can convert the Pandas dataframe to a Hugging Face dataset:
import datasets

ds = datasets.Dataset.from_pandas(df)

ds.save_to_disk('f1telemetry')
When we load the Arrows-based dataset, we only use a negligible amount of RAM due to the memory-mapping functionality from Arrows:
import datasets
import psutil

print('memory used in MB:', psutil.virtual_memory()[3]/ 1024 ** 2)
ds = datasets.Dataset.load_from_disk('f1telemetry')
print('memory used in MB:', psutil.virtual_memory()[3]/ 1024 ** 2)
When we visualize the Arrows-based dataset with Spotlight, all time series data is loaded lazily. In this way, even large datasets can easily be processed:
from renumics import spotlight

spotlight.show(ds)