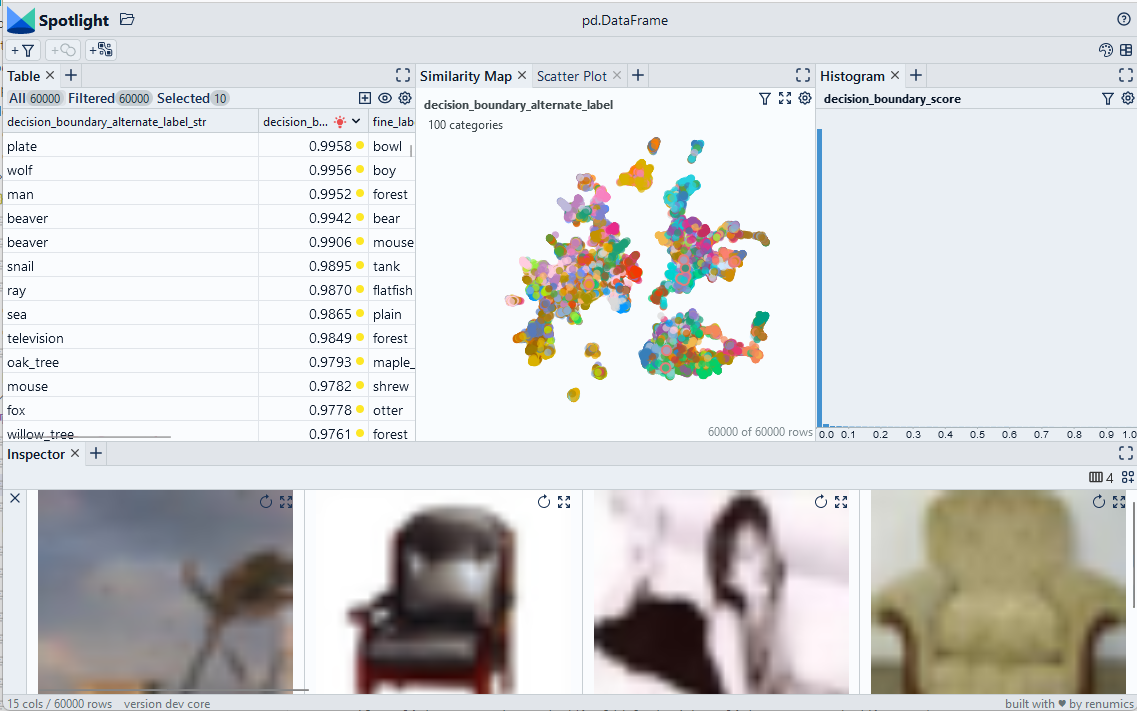
Detect decision boundaries based on certainty ratios
We use certainty ratios to compute a decision boundary score.
Use Chrome to run Spotlight in Colab. Due to Colab restrictions (e.g. no websocket support), the performance is limited. Run the notebook locally for the full Spotlight experience.
- inputs
- outputs
- parameters
df['probabilities']contain the class probability vector that was inferred by the model
df['decision_boundary_score']contains a score between 0 and 1 that indicates how close the data sample is to the decision boundary. 1 means the data sample is on the decision boundary, 0 means it is far away.

Imports and play as copy-n-paste functions
# Install dependencies
#@title Install required packages with PIP

!pip install renumics-spotlight datasets
# Play as copy-n-paste functions
import datasets
import numpy as np
import pandas as pd
from renumics import spotlight
import requests

def boundary_score(df, probabilities_name='probabilities'):
    def compute_score(probs):
        indices=np.argsort(probs)[::-1]
        score = [indices[0], indices[1], probs[indices[0]],probs[indices[1]] ]

        return score

    df_out=pd.DataFrame()
    temp_scores=[compute_score(x) for x in df[probabilities_name]]
    df_out['decision_boundary_score']=[x[3]/x[2] for x in temp_scores]
    df_out['decision_boundary_alternate_label']=[x[1] for x in temp_scores]


    return df_out
Step-by-step example on CIFAR-100
Load CIFAR-100 from Huggingface hub and convert it to Pandas dataframe
dataset = datasets.load_dataset("renumics/cifar100-enriched", split="train")
df = dataset.to_pandas()
Compute decision boundary score and alternate label
f_boundary = boundary_score(df)
df = pd.concat([df, df_boundary], axis=1)
df['decision_boundary_alternate_label_str']=[dataset.features["fine_label"].int2str(x) for x in df['decision_boundary_alternate_label']]
Inspect decision boundary with Spotlight
df_show = df.drop(columns=['embedding', 'probabilities'])
layout_url = "https://raw.githubusercontent.com/Renumics/spotlight/playbook_initial_draft/playbook/rookie/decision_boundary_layout.json"
response = requests.get(layout_url)
layout = spotlight.layout.nodes.Layout(**json.loads(response.text))
spotlight.show(df_show, dtype={"image": spotlight.Image, "embedding_reduced": spotlight.Embedding}, layout=layout)