
Every electromechanical product produces lots of data throughout its lifecycle. This is not only true for planes or cars, but also for many everyday appliances such as vacuums or microwaves. In theory all this test-, simulation- and operational data can be used to understand usage, troubleshoot problems and improve the product. However, this holistic view (digital twin) has remained an elusive pipe dream for most engineering teams.
The reality hits different: It is already challenging to just combine all testing data into a single system, let alone fusing it with simulation and operational data. Engineers have to ask data experts to create custom analysis reports even for simple questions. Automated analysis pipelines produce hundreds of PDF or HTML pages that must be manually curated into a slide deck in order to be shared with stakeholders.
These challenges can be overcome by using agentic AI systems on top of a modern engineering data management stack. In the first part of this blog, our partner Peak Solution demonstrated how ASAM-compatible standards, such as ODS, can be leveraged to create a unified view of all testing data—effectively bridging data silos. In this blog, we outline how agentic AI system can help to democratize access to this data and to build automated workflows that capture the individual knowledge of engineers.
Use cases for agentic AI in engineering data analysis
Agentic AI can help to democratize and automate all parts of engineering data analysis. To this end, agentic AI systems can enrich existing datasets with semantic information, build data queries and create interactive visualizations.
For this blog, we consider two example use cases:
1. Automotive data analysis
When analyzing logging data from test vehicles or traces from the fleet, engineers are often tasked to understand the impact of a certain change (e.g. software update) or to investigate a malfunction. Typical questions are:
- “Show me the error count by category for each software version” to get a feel for overall error rates with respect to certain software variants.
- “Show me all occurrences of battery errors in the last week” to start an in-depth investigation of concrete failures.
- “Visualize all signals that are relevant for the battery error in the current ticket” to quickly dive into an interactive analysis.
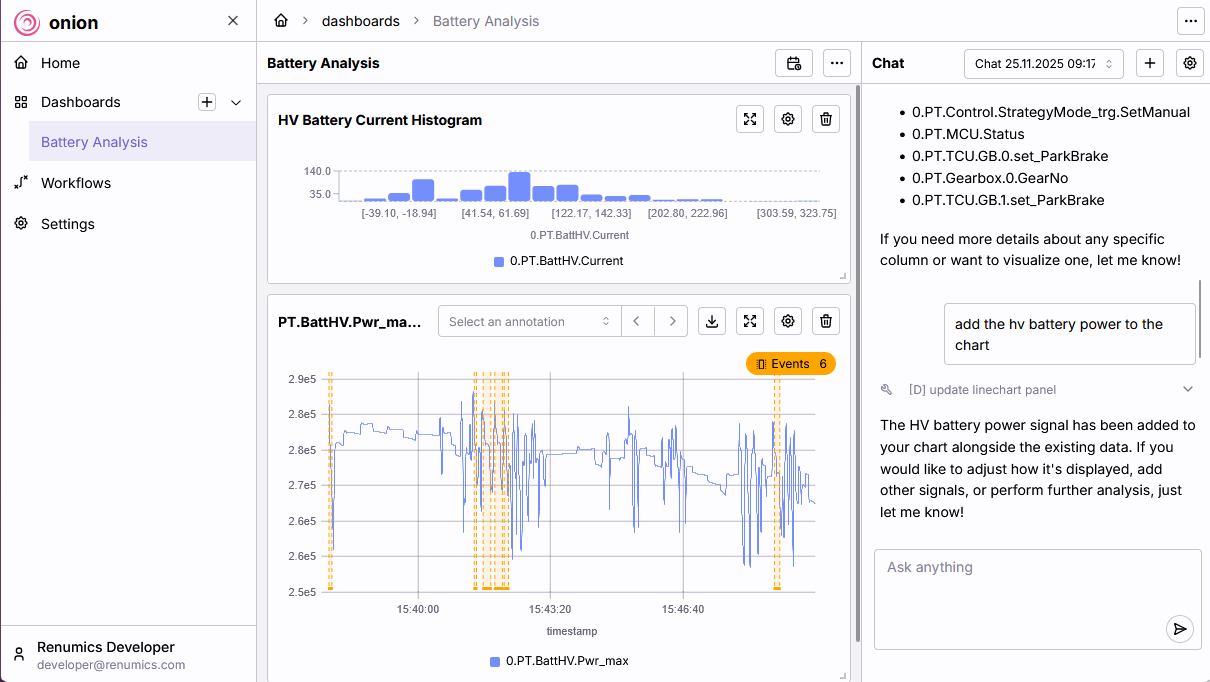
Fig.1 Analyzing events in an electrical powertrain system with Renumics Onion.
2. Plausability check for testing setup
Ensuring data quality before analysis is critical. Agentic AI can automate the validation of the setup:
- “Are there swapped channels in the testing data?” to guard against mistakes in the testing setup.
- “Identify missing sensor data.” to identify equipment failure early.
- “Run a complete plausibility check.” to guard against common setup and equipment errors.
Bridging the gap between a natural language question and a concrete engineering result requires a specific architecture: Agentic AI.
How agentic AI Systems for data analysis work
An agentic AI assistant moves beyond a simple chatbot to become an active participant in the analysis process. The agentic AI paradigm is defined by the use of Large Language Models (LLMs) within larger, more complex workflows. Such a system does not just generate text: it can reason, create plans, and execute actions on real-world data.
This system is built on three main components, which map to established agentic design patterns.
1. The reasoning and planning component
At the center is an LLM that acts as the reasoning engine. Its primary task is flow control: the ability to make and execute plans to achieve a given goal.
When an engineer provides a natural-language request (e.g., “Find swapped channels in test file X and show me the affected signals”), the LLM's role is to:
- Understand the natural-language request.
- Break it down into a sequence of steps and sub-tasks (e.g., load data → find candidate channels → run checks →visualize results).
Instead of hard-coding every workflow, this pattern allows the LLM to infer the necessary sequence of actions from the user's goal.
2. Executable tools
An LLM itself cannot open a Parquet file or compute a spectrum. To act on real data, the agent must be granted access to a curated set of pre-defined functions and APIs. This pattern is known as tool use or tool calling.
These tools may include:
- Loading and filtering measurement data
- Performing signal-processing or quality checks
- Generating plots and dashboards
The agent's task is to determine which tool to call, in which order, and with which parameters. In practice, that means the system does not replace existing analysis code, but rather, it drives it. If a team adds a new function (e.g., a new data anomaly detector), it is simply exposed as another tool the agent can utilize.
3. Configurable workflows and roles
For different tasks, the agent can be configured with specific instructions that define its role and workflow. This often involves handing off the context to another, more specialized agent.
A simple text prompt can define the agent's parameters:
- Goal: (e.g., “You are an error-detection assistant for automotive time-series data”).
- Tools: Which tools from the available set it is permitted to use.
- Strategy: A step-by-step strategy to follow (e.g., “First, run a basic stuck-value check, then summarize the most likely issues and propose plots”).
This approach allows experts to define and modify analysis workflows by editing natural language, not code. It makes it easy to iterate on analytical processes and encode domain knowledge directly into the assistant.
Use Case 1: Finding and displaying data
- The Request: An engineer asks: “Show me the motor temperature and pressure for the last hour.”
- The Workflow:
- The orchestrator classifies this as a data access and visualization task.
- It hands off the request to a visualization specialist agent.
- This sub-agent uses its tools to:
- Resolve "motor temperature" and "pressure" to the correct channel names in the data source.
- Execute a query to load the relevant time window from the data files.
- Call plotting tools to configure the chart (scales, labels, legend) and return it to the user interface.
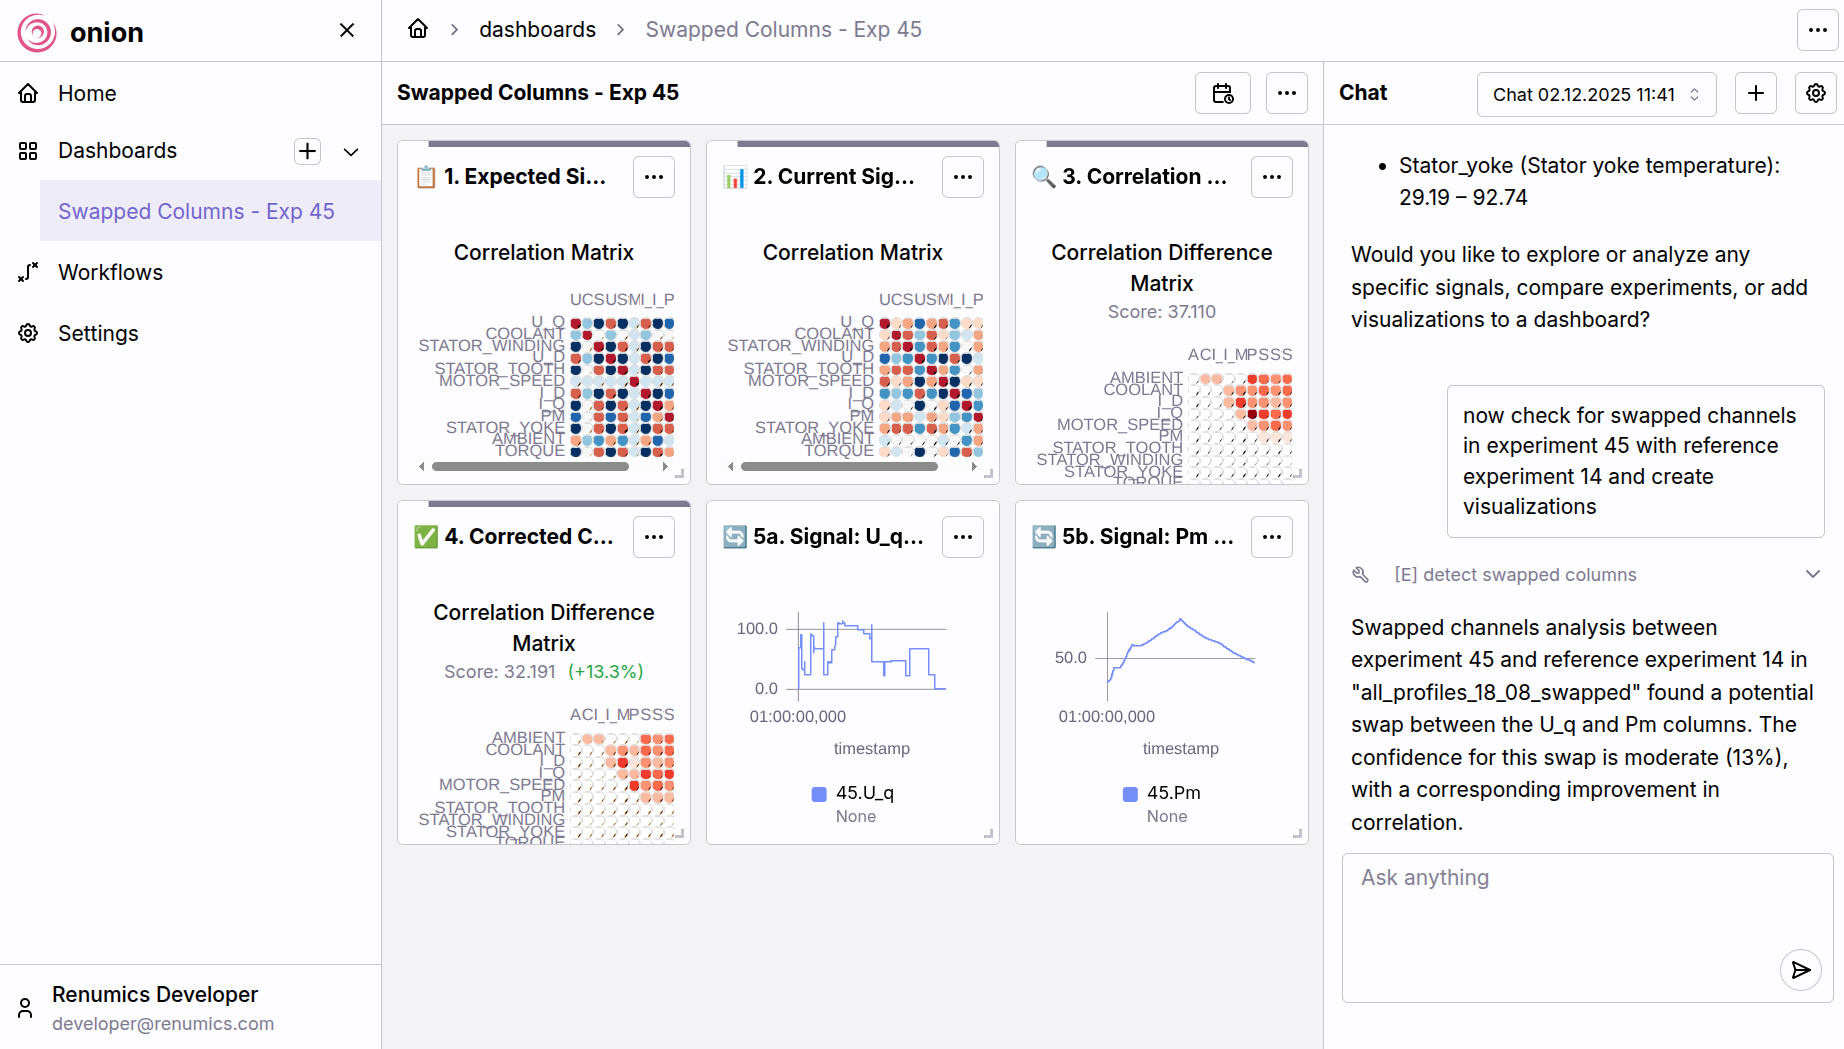
Fig.2 Analyzing error-related events (here: swapped channels) with Renumics Onion.
Use Case 2: Automated error analysis
- The Request: An engineer requests: “Check experiment 71 for stuck values and swapped channels.”
- The Workflow:
- The orchestrator routes this task to an error-analysis specialist agent.
- This agent follows its pre-defined plan:
- It uses data-access tools to load the specified measurement data.
- It executes a set of quality checks (e.g., stuck values, missing data) using its signal-processing tools.
- It applies heuristics or models to detect likely swapped channels by comparing signal names, metadata, and statistical behavior.
- The agent then forwards these findings to the visualization specialist, which prepares annotated plots highlighting the problematic regions or channels.
The result is an interactive workflow that allows engineers to immediately explore suspect signals, rather than manually hunting through hundreds of channels.
Conclusion
Agentic AI systems close the gap between fragmented engineering data and the insights teams need to move fast. In the first article of this blog series, our partner Peak Solutions showed how modern data standards like ASAM ODS can be used to provide a common interface to testing data. In this article, we showed concrete examples how agentic AI can help engineering teams in testing data analysis. By combining LLM-driven reasoning, tool use, and configurable workflows, engineers can query data in natural language, automate complex checks, and codify expert knowledge without changing existing analysis code.
This enables engineering teams to overcome the three core challenges in product development today: To break open data silos, to democratize access to data and to automate routine tasks.