Detect data drift with the k-core distance
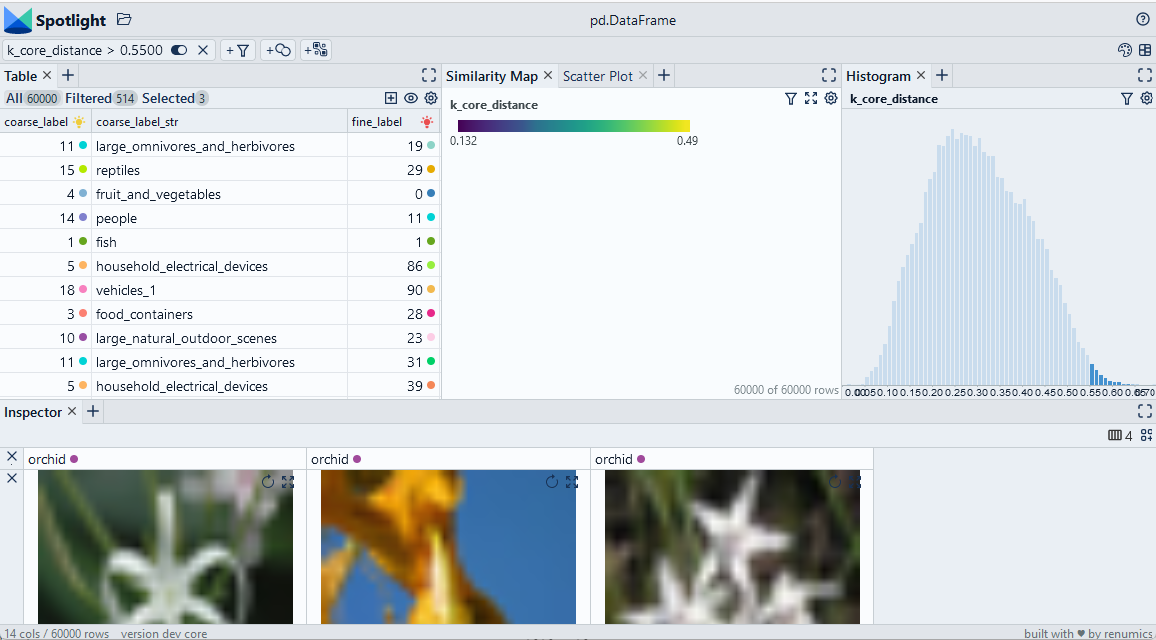
We compute the cosine distance of the k-nearest neighbor in the embedding space for each data sample. This distance can be used to detect outliers/drifted samples. We find a suitable outlier threshold by inspecting the data with Spotlight.
Use Chrome to run Spotlight in Colab. Due to Colab restrictions (e.g. no websocket support), the performance is limited. Run the notebook locally for the full Spotlight experience.
- inputs
- outputs
- parameters
df['embedding']contain the embeddings for each data sample
df_leak['k_core_distance']contains the cosine distance to the k-th neighbor of the data sampledf_leak['k_core_index']contains the index to the k-th neighbor of the data sample
kdenotes the k-th neighbor to which the distance is measured.
Imports and play as copy-n-paste functions
# Install dependencies
#@title Install required packages with PIP

!pip install renumics-spotlight datasets
# Play as copy-n-paste functions
#@title Play as copy-n-paste functions

from sklearn.neighbors import NearestNeighbors
import pandas as pd
import numpy as np
import datasets
from renumics import spotlight

def compute_k_core_distances(df, k=8, embedding_name='embedding'):
    features = np.stack(df[embedding_name].to_numpy())
    neigh = NearestNeighbors(n_neighbors=k, metric='cosine')
    neigh.fit(features)
    distances, indices = neigh.kneighbors()

    df_out=pd.DataFrame()
    df_out['k_core_distance']=distances[:,-1]
    df_out['k_core_index']=indices[:, -1]

    return df_out
Step-by-step example on CIFAR-100
Load CIFAR-100 from Huggingface hub and convert it to Pandas dataframe
dataset = datasets.load_dataset("renumics/cifar100-enriched", split="train")
df = dataset.to_pandas()
Compute k-nearest neighbor distances
df_kcore = compute_k_core_distances(df)
df = pd.concat([df, df_kcore], axis=1)
Inspect candidates for data drift with Spotlight
df_show = df.drop(columns=['embedding', 'probabilities'])
layout_url = "https://raw.githubusercontent.com/Renumics/spotlight/playbook_initial_draft/playbook/rookie/drift_kcore.json"
response = requests.get(layout_url)
layout = spotlight.layout.nodes.Layout(**json.loads(response.text))
spotlight.show(df_show, dtype={"image": spotlight.Image, "embedding_reduced": spotlight.Embedding}, layout=layout)